本文最后更新于 2026年3月16日 晚上
前言&前提 Home Assistant 中,传感器实体对象 sensor 可以获取对象的信息,比如:自定义的光线传感器、人体传感器等。
这其中,有一个特殊的传感器:Command Line Sensor(命令行传感器),使用它,可以激活Python、Shell等脚本,进而通过脚本获取数据。
比如:本文就通过Shell和Python脚本,获取树莓派的CPU温度、CPU使用率、存储使用情况和内存使用情况:
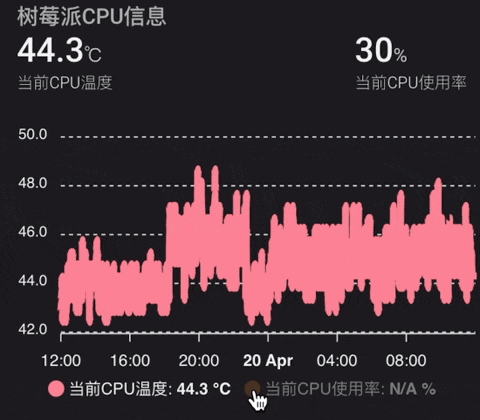
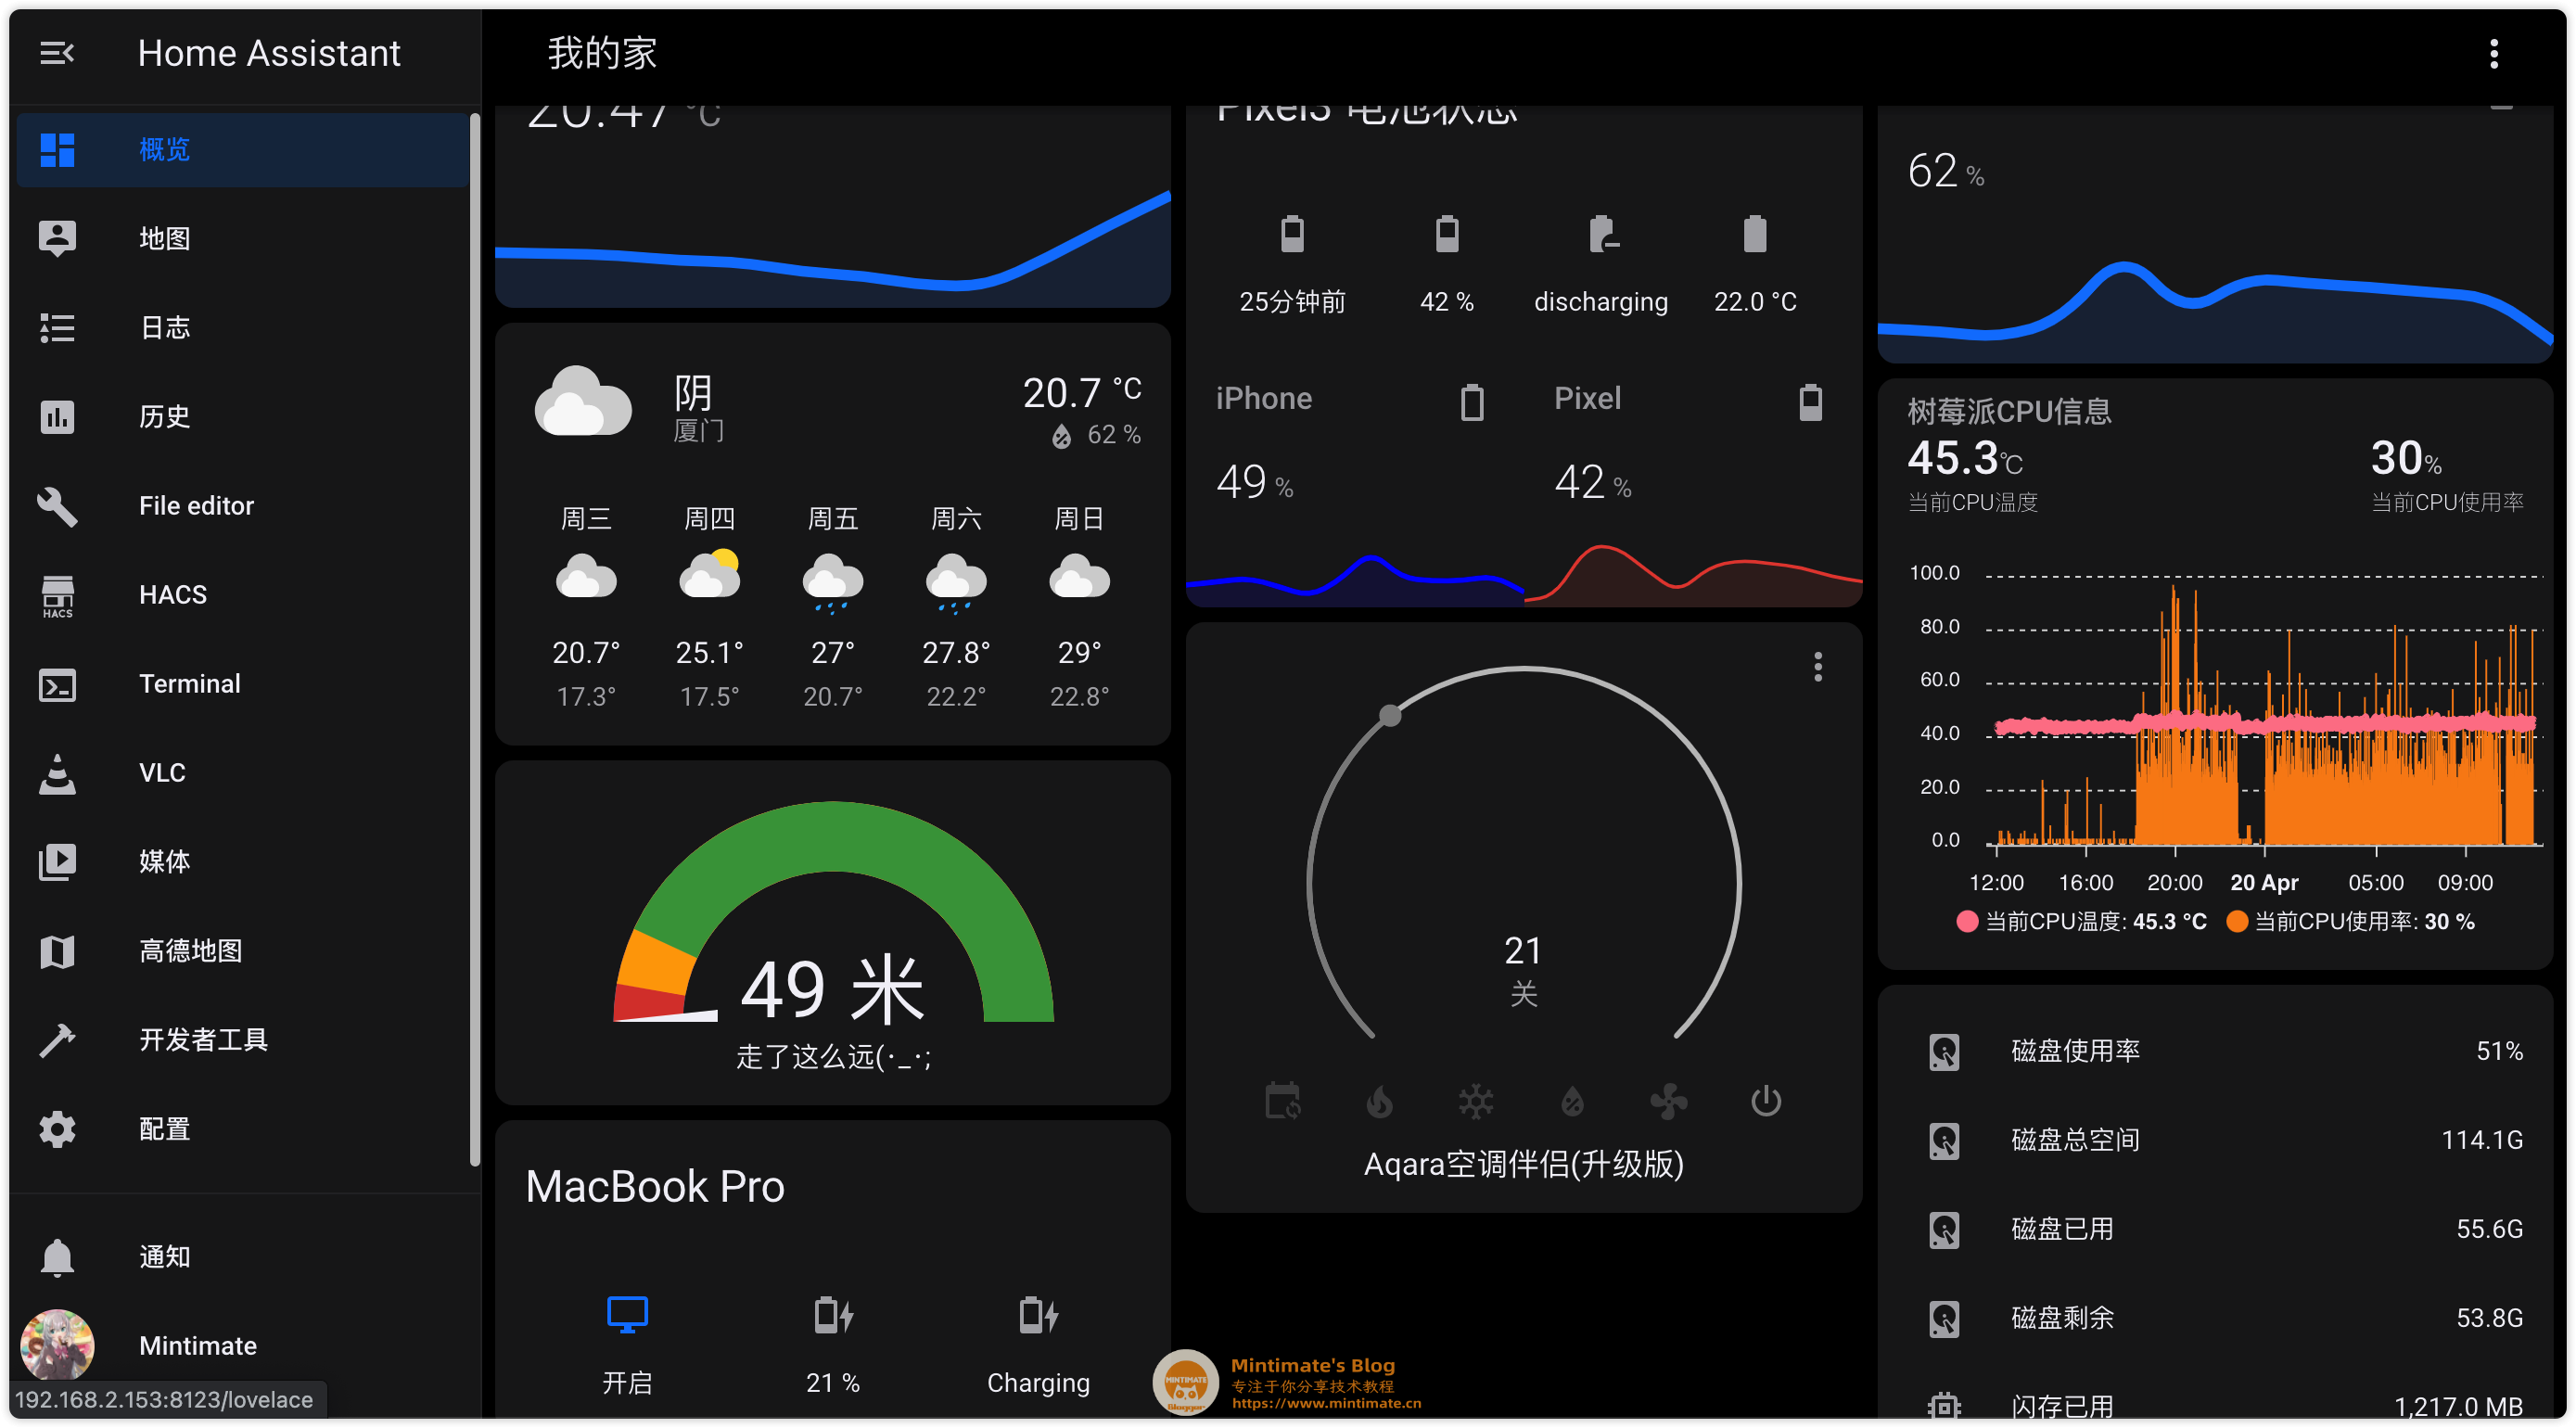
配合第三方前端卡片插件apexcharts-card ,可以达到效果:
本文参考:https://bbs.hassbian.com/thread-8475-1-1.html
前提 使用的前提很简单,我们需要一台安装了Home Assistant的树莓派,如果你的树莓派并没有安装Home Assistant Core或者Supervised,可以参考教程:
如果树莓派安装的是System版本,理论上也可以使用本教程。
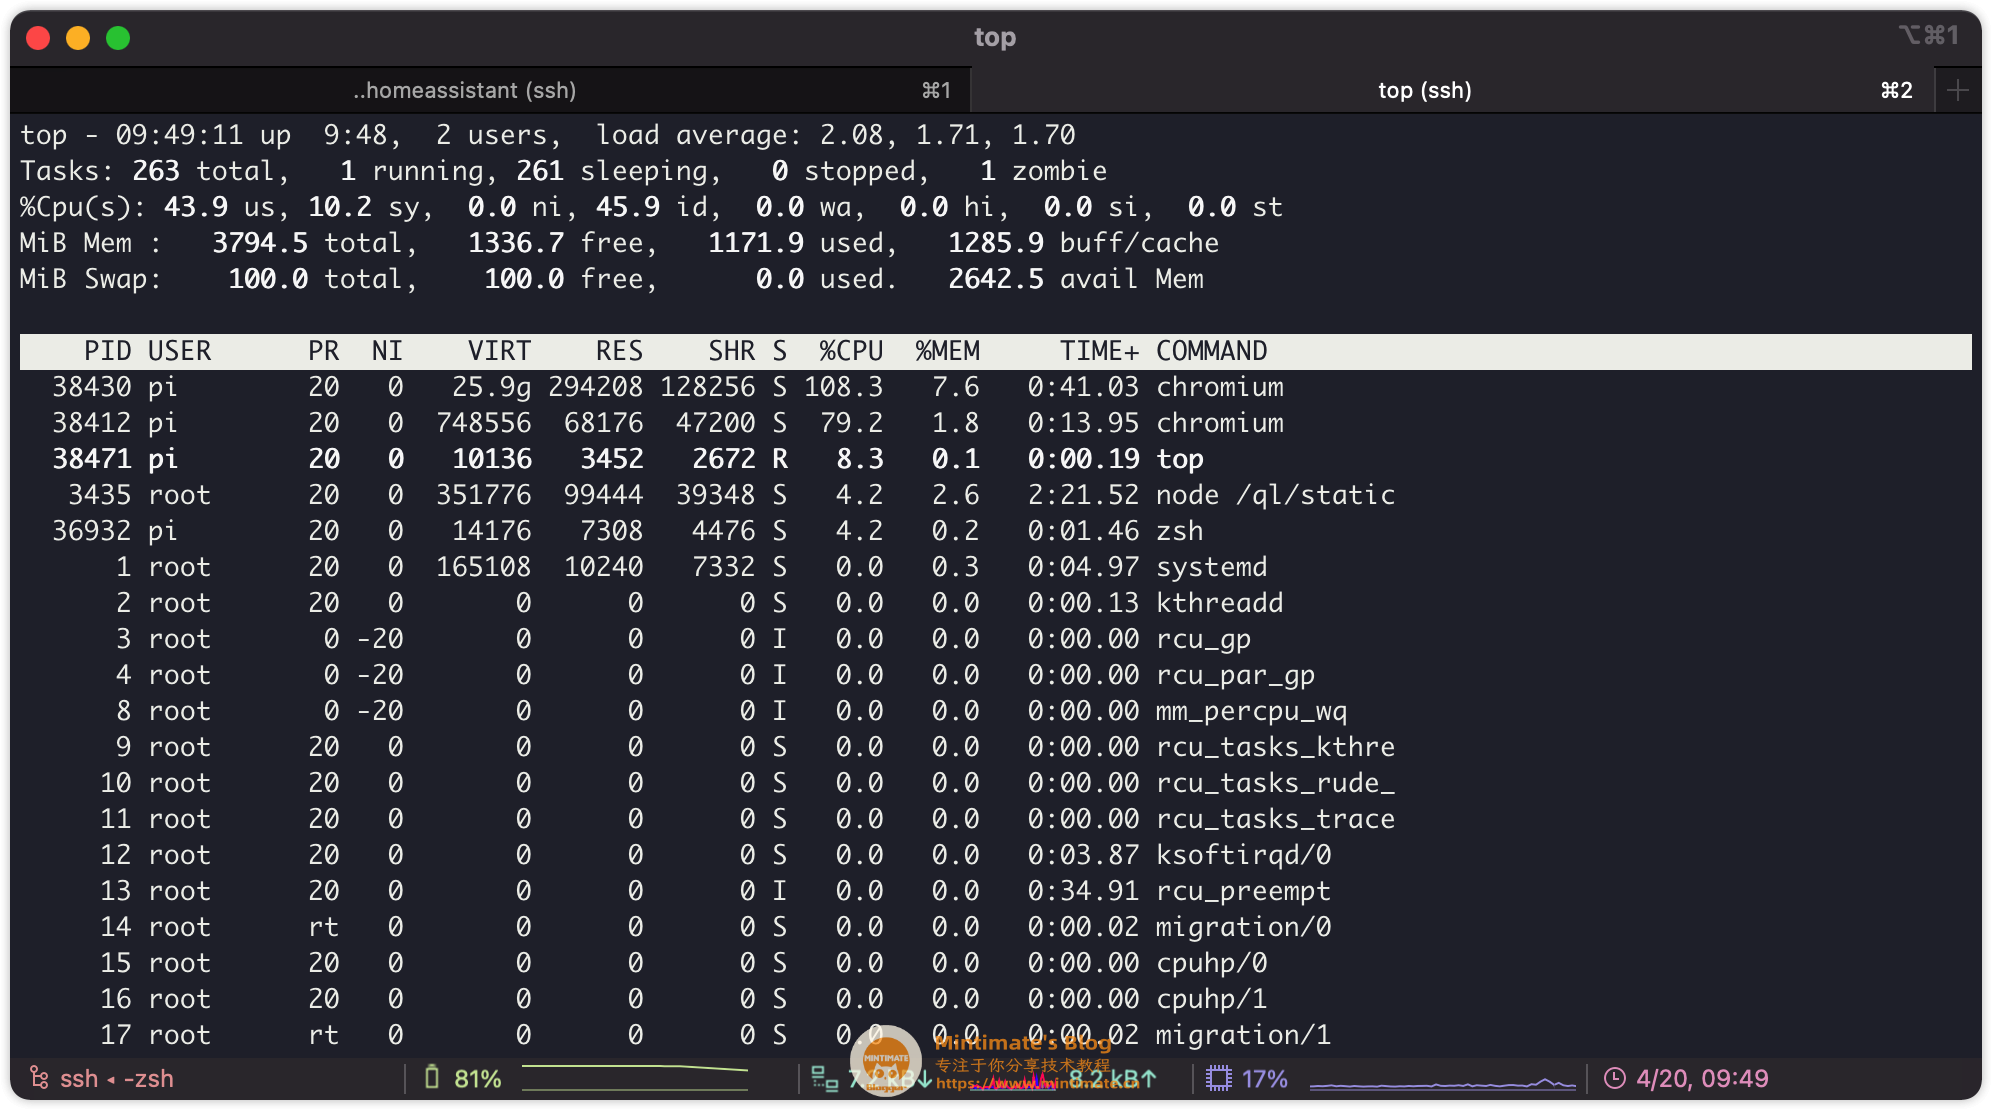
Shell获取信息 首先,我们要知道,如何使用Shell获取树莓派的信息呢?很简单,简单的cat、free和df、top命令即可完成。
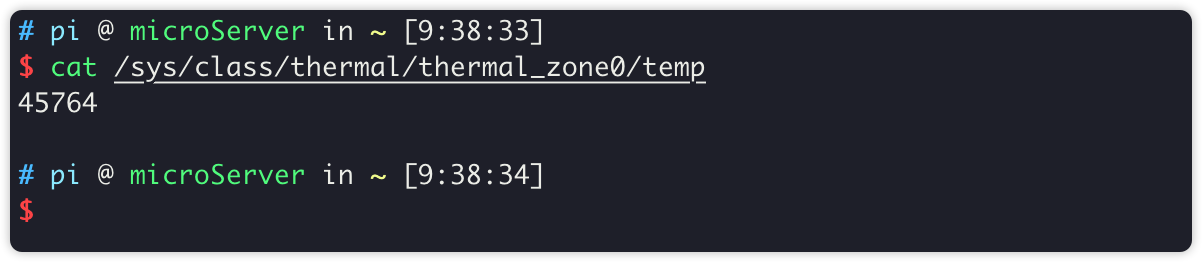
CPU温度 如果我们需要获取CPU的温度,可以在临时分区缓存文件内获取:
1 2 cat /sys/class/thermal/thermal_zone0/temp
45.764摄氏度。
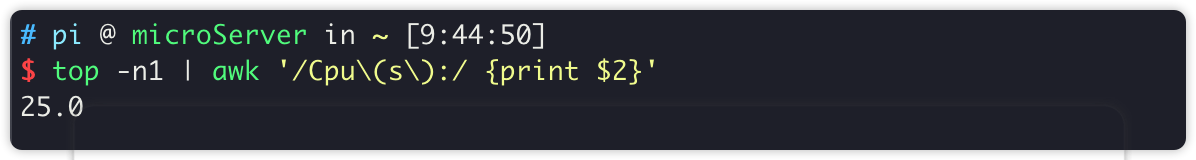
CPU使用率 CPU使用有点麻烦,最终的命令是:
1 top -n1 | awk '/Cpu\(s\):/ {print $2}'
top命令,这个是获取系统信息的:-n1代表取消交互模式,只获取一次输出刷新。配合awk实现字段截取。
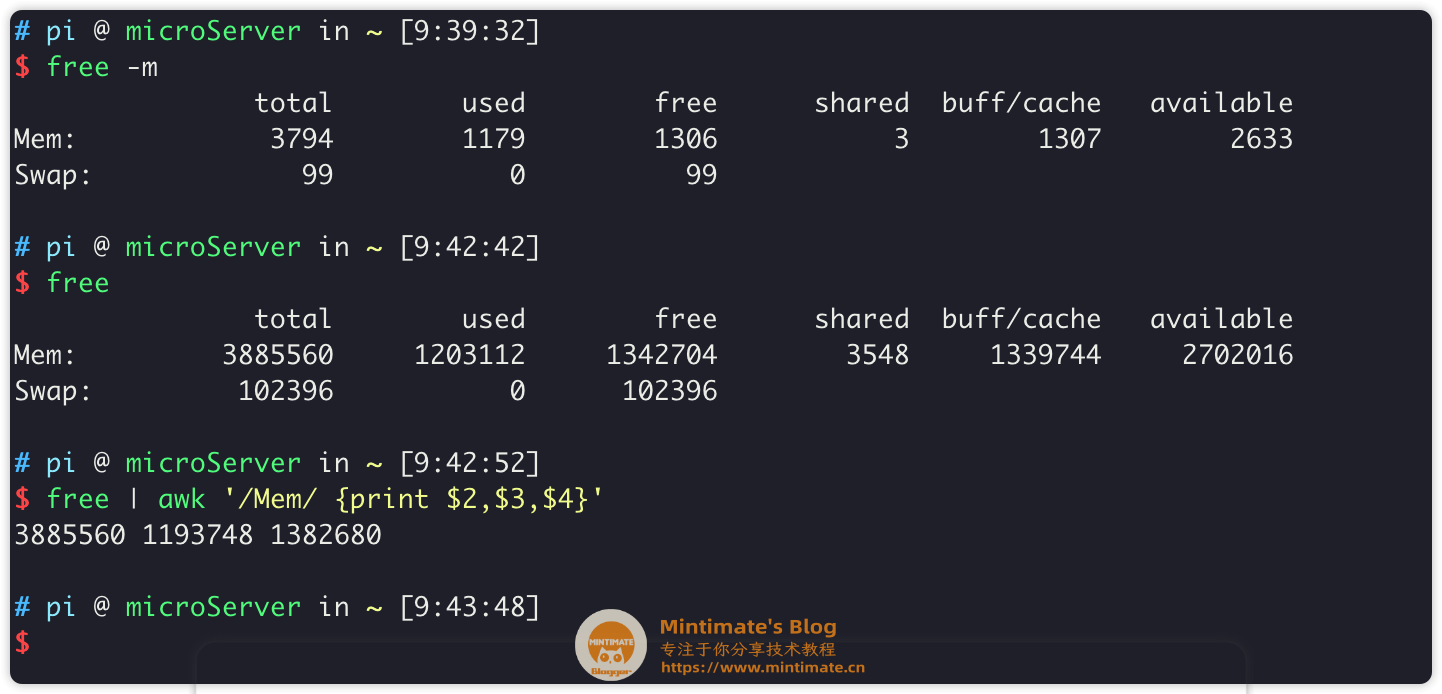
内存使用 内存的话,就更简单了,直接使用free命令,配合“三剑客”中的awk即可:
1 free | awk '/Mem/ {print $2,$3,$4}'
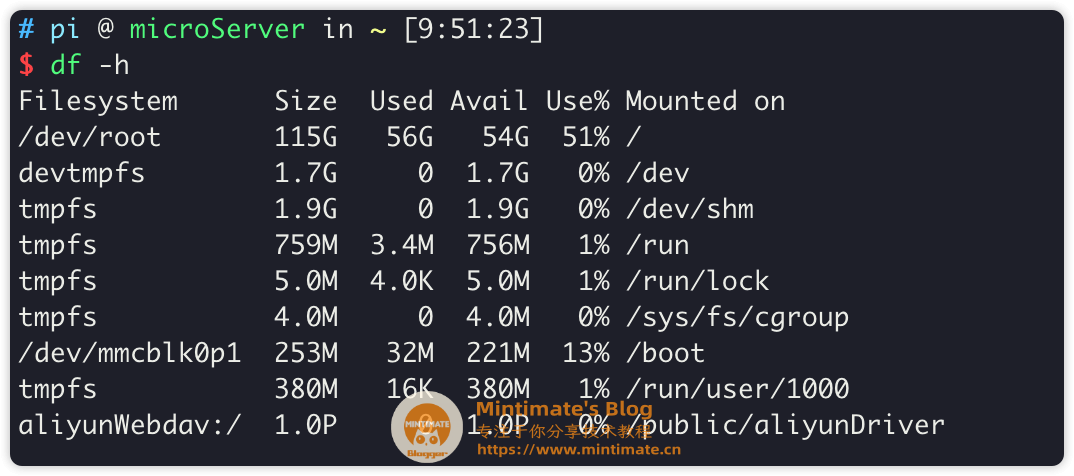
磁盘使用 磁盘使用就很简单了,信息大家都清楚。只需要:
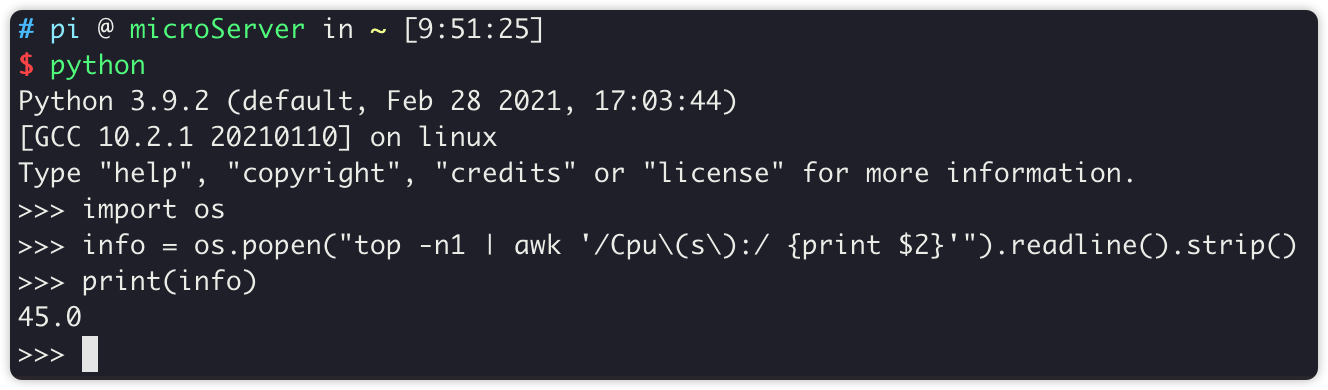
Python封装 之后,我们把上述的Shell命令,使用Python脚本去调用。只需要使用Python的os包,配合os.popen方法即可运行Shell命令。比如:
1 2 3 4 "top -n1 | awk '/Cpu\(s\):/ {print $2 }'" ).readline().strip()print (info)
1
2
3
4
5
6
7
8
9
10
11
12
13
14
15
16
17
18
19
20
21
22
23
24
25
26
27
28
29
30
31
32
33
34
35
36
37
38
39
40
41
42
43
44
45
46
47
import osimport jsondef getCPUtemperature ():"cat /sys/class/thermal/thermal_zone0/temp" )int (f.readline().strip())/1000 return round (temp, 1 )def getRAMinfo ():"free | awk '/Mem/ {print $2,$3,$4}'" )round (int (i)/1024 , 1 ) for i in info]return infodef getCPUinfo ():"top -n1 | awk '/CPU:/ {print $2}'" ).readline().strip()if info=="" :0 return infodef getDiskinfo ():"df -h /" )1 ].split()[1 :5 ]return infoif __name__ == '__main__' :'CPUtemp' ] = getCPUtemperature()'RAMinfo' ] = getRAMinfo()'DISKinfo' ] = getDiskinfo()'CPUuse' ] = getCPUinfo()print (json.dumps(RaspiInfo))
获取运行一下:
需要注意:CPU使用的获取,Home Assistant内使用的是Docker环境;所以top命令获取的CPU和真实环境获取CPU信息不一样。
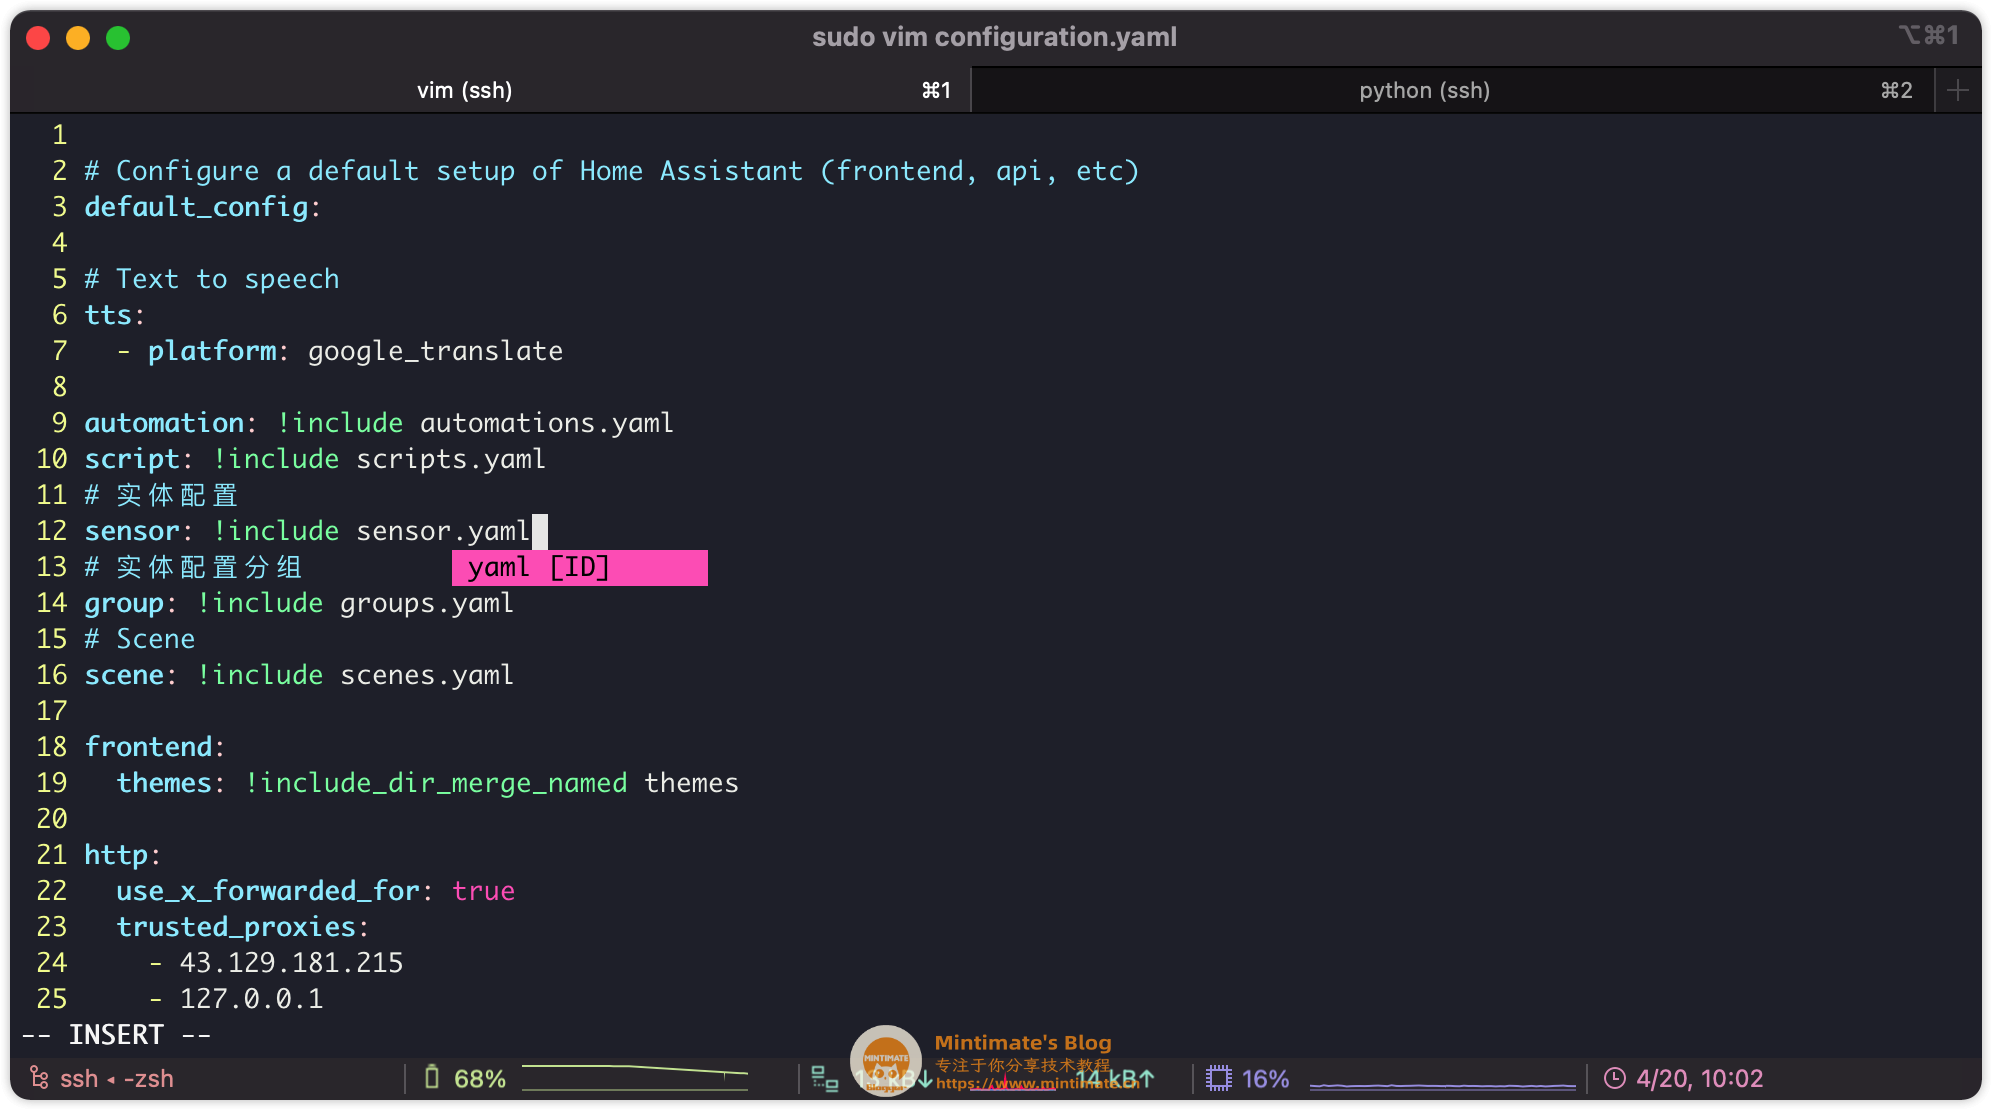
Command Senior 参考官方文档:https://www.home-assistant.io/integrations/sensor.command_line/
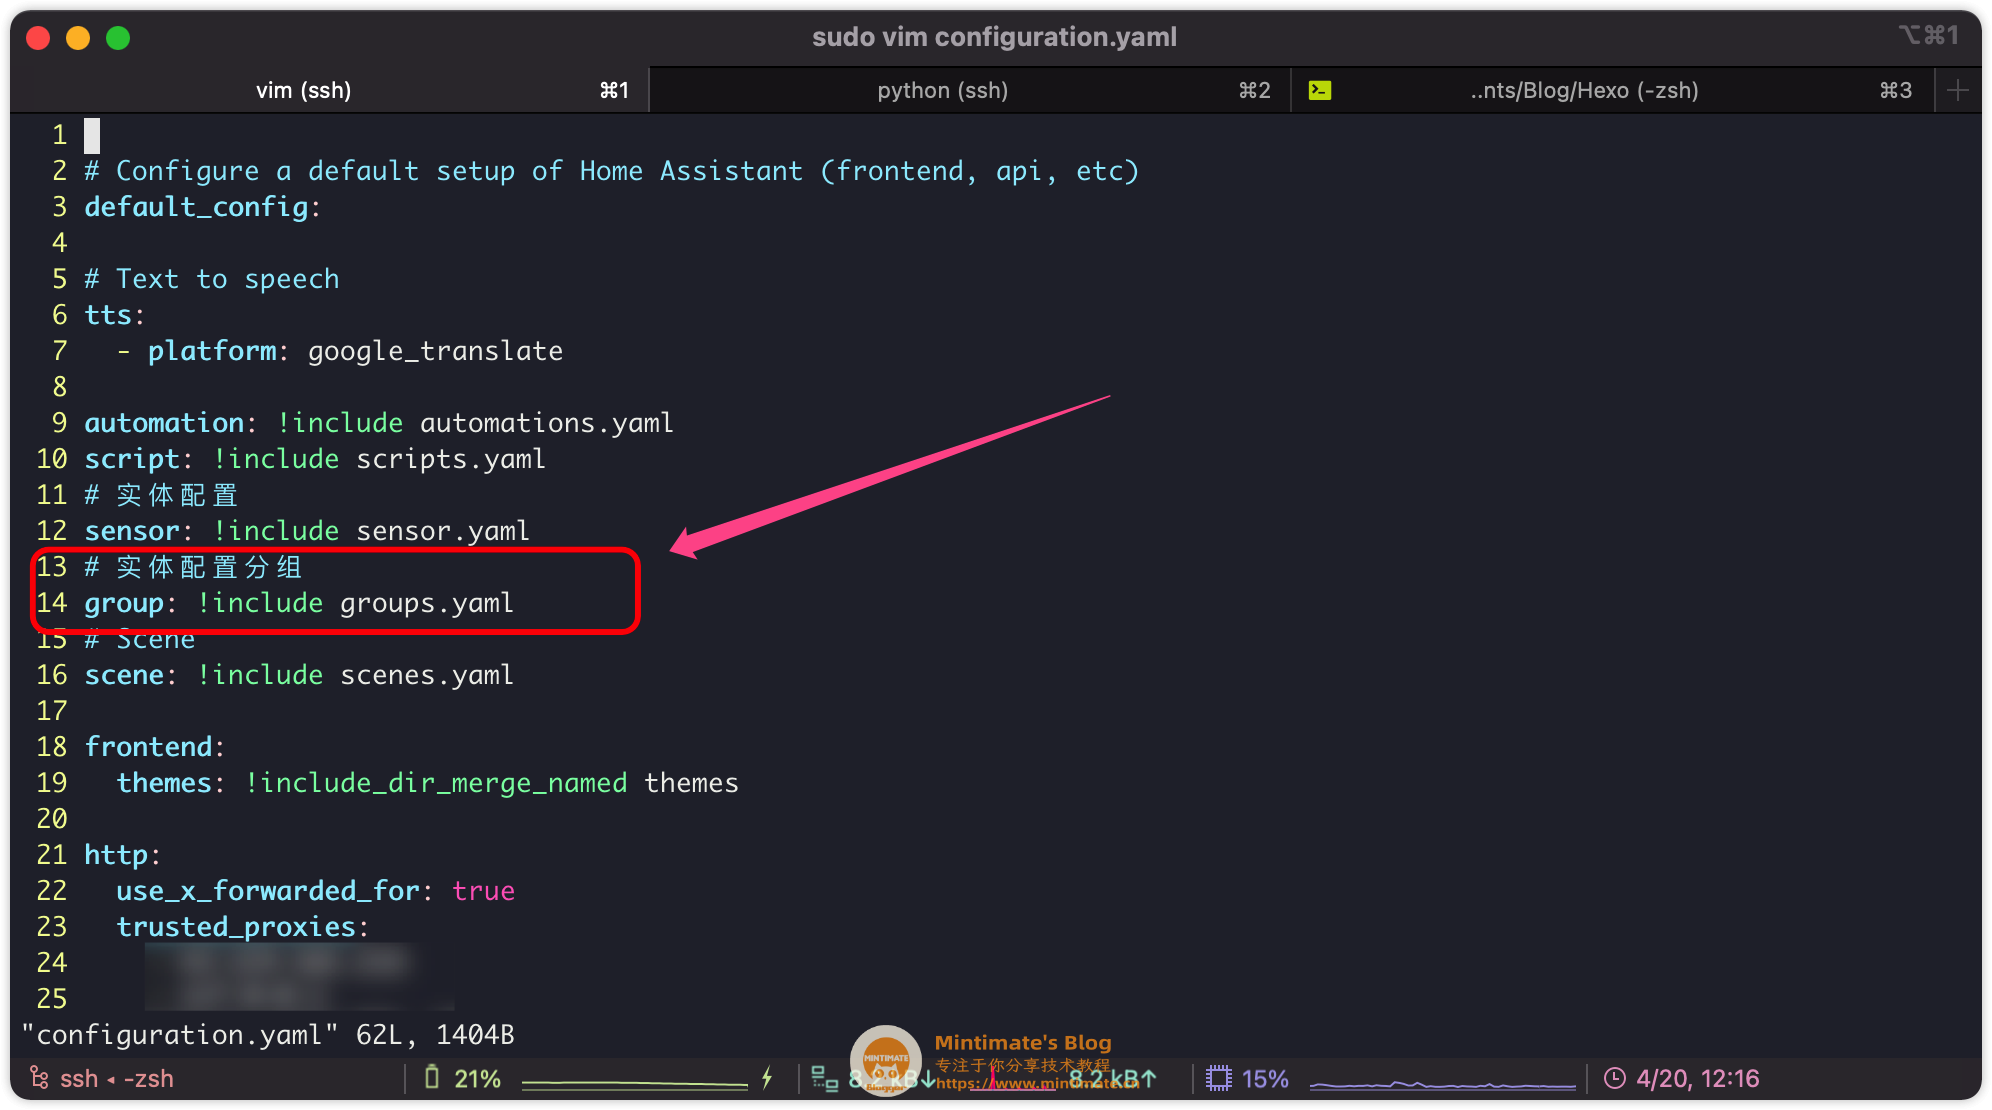
我们需要创建一个Command Line传感器,为了避免为的Home Assistant核心配置文件过长,我这里使用YAML外部引用的方式,引用一个单独的配置文件进行追加:
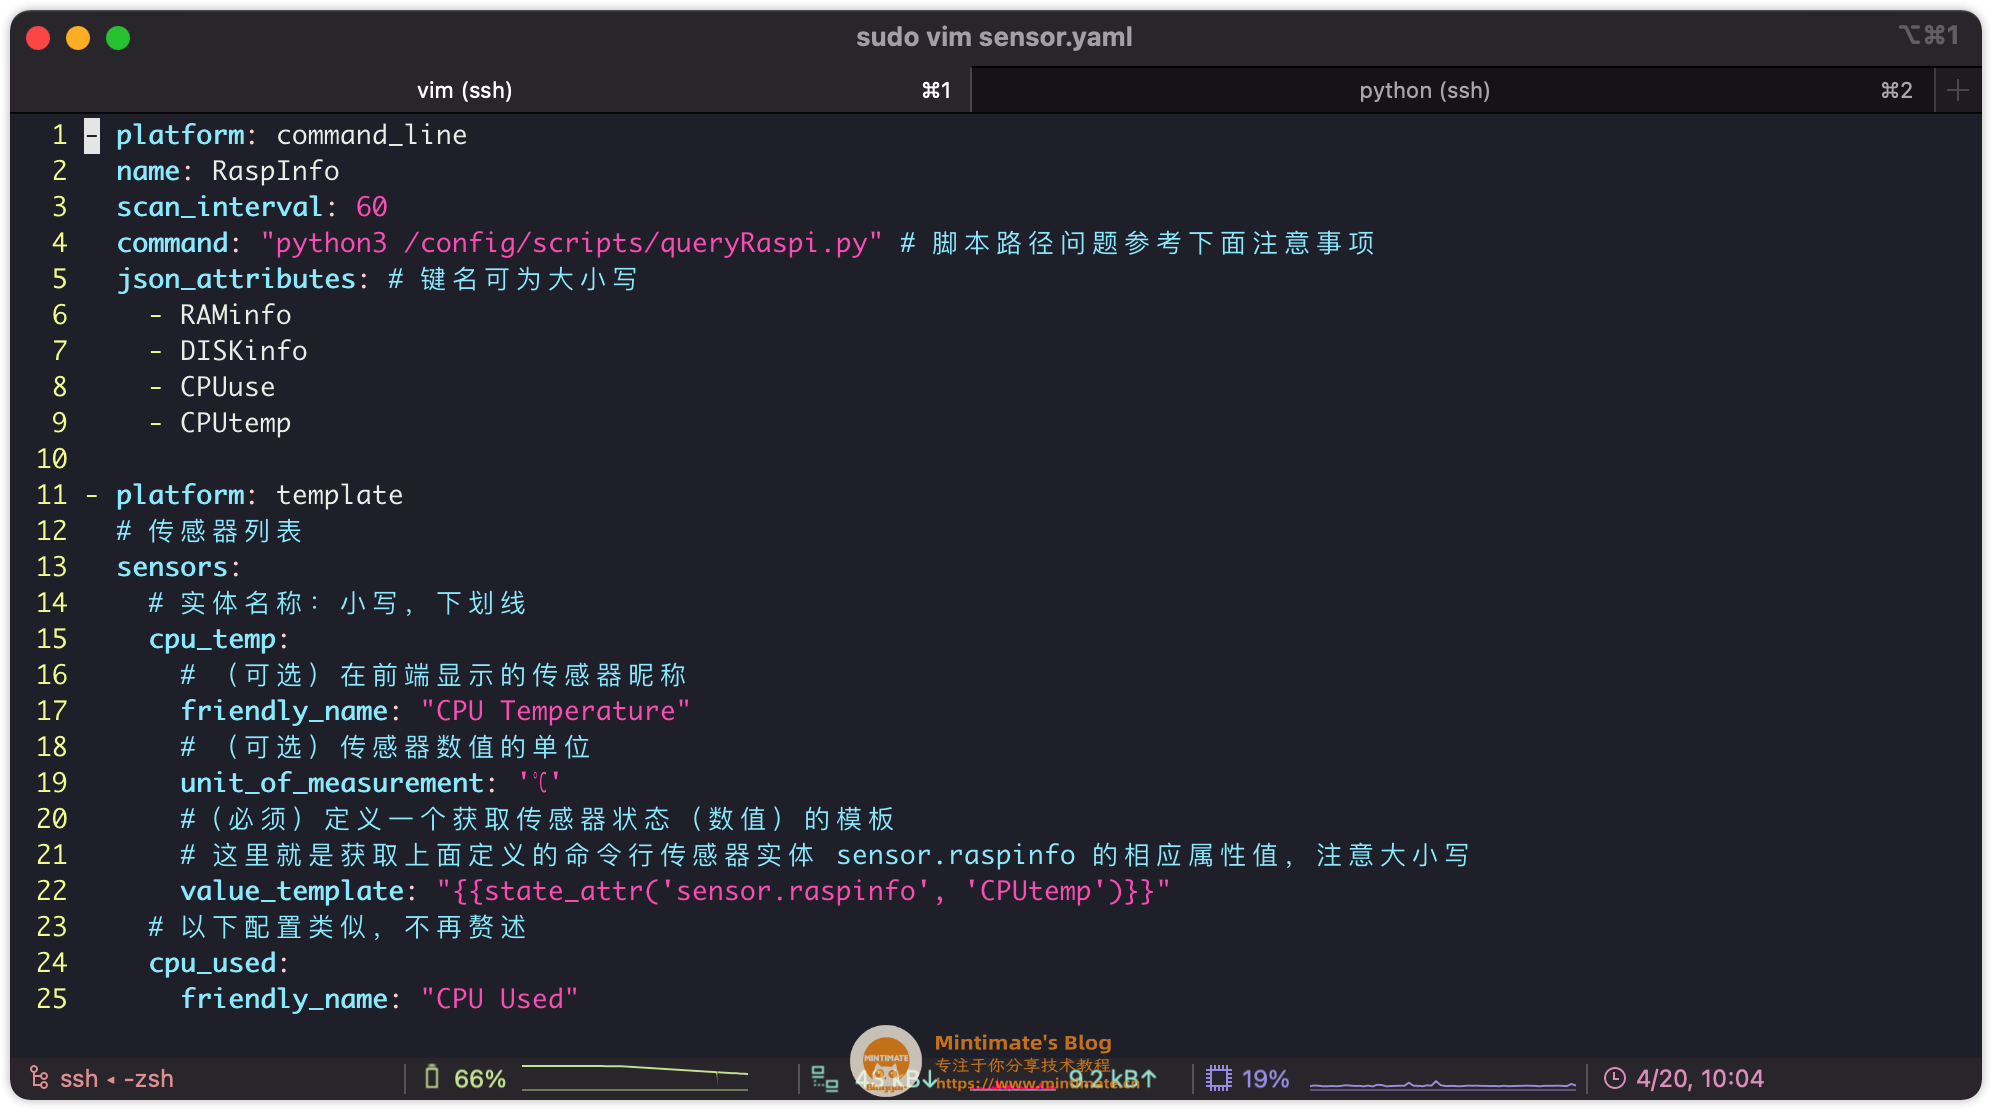
1
2
3
4
5
6
7
8
9
10
11
12
13
14
15
16
17
18
19
20
21
22
23
24
25
26
27
28
29
30
31
32
33
34
35
36
37
38
39
40
41
42
43
44
45
46
47
48
49
50
51
- platform: command_line name: RaspInfo scan_interval: 60 command: "python3 /config/scripts/queryRaspi.py" json_attributes: - RAMinfo - DISKinfo - CPUuse - CPUtemp - platform: template sensors: cpu_temp: friendly_name: "CPU Temperature" unit_of_measurement: '℃' value_template: "{{state_attr('sensor.raspinfo', 'CPUtemp')}} " cpu_used: friendly_name: "CPU Used" value_template: "{{state_attr('sensor.raspinfo', 'CPUuse')}} " ram_total: friendly_name: "RAM total" unit_of_measurement: 'MB' value_template: "{{state_attr('sensor.raspinfo', 'RAMinfo')[0]}} " ram_used: friendly_name: "RAM used" unit_of_measurement: 'MB' value_template: "{{state_attr('sensor.raspinfo', 'RAMinfo')[1]}} " ram_free: friendly_name: "RAM free" unit_of_measurement: 'MB' value_template: "{{state_attr('sensor.raspinfo', 'RAMinfo')[2]}} " disk_total: friendly_name: "DISK total" value_template: "{{state_attr('sensor.raspinfo', 'DISKinfo')[0]}} " disk_used: friendly_name: "DISK used" value_template: "{{state_attr('sensor.raspinfo', 'DISKinfo')[1]}} " disk_left: friendly_name: "DISK left" value_template: "{{state_attr('sensor.raspinfo', 'DISKinfo')[2]}} " disk_percentage: friendly_name: "DISK percentage" value_template: "{{state_attr('sensor.raspinfo', 'DISKinfo')[3]}} "
其中:platform-command为我们刚刚写的Python脚本 ,注意自己的文件地址。
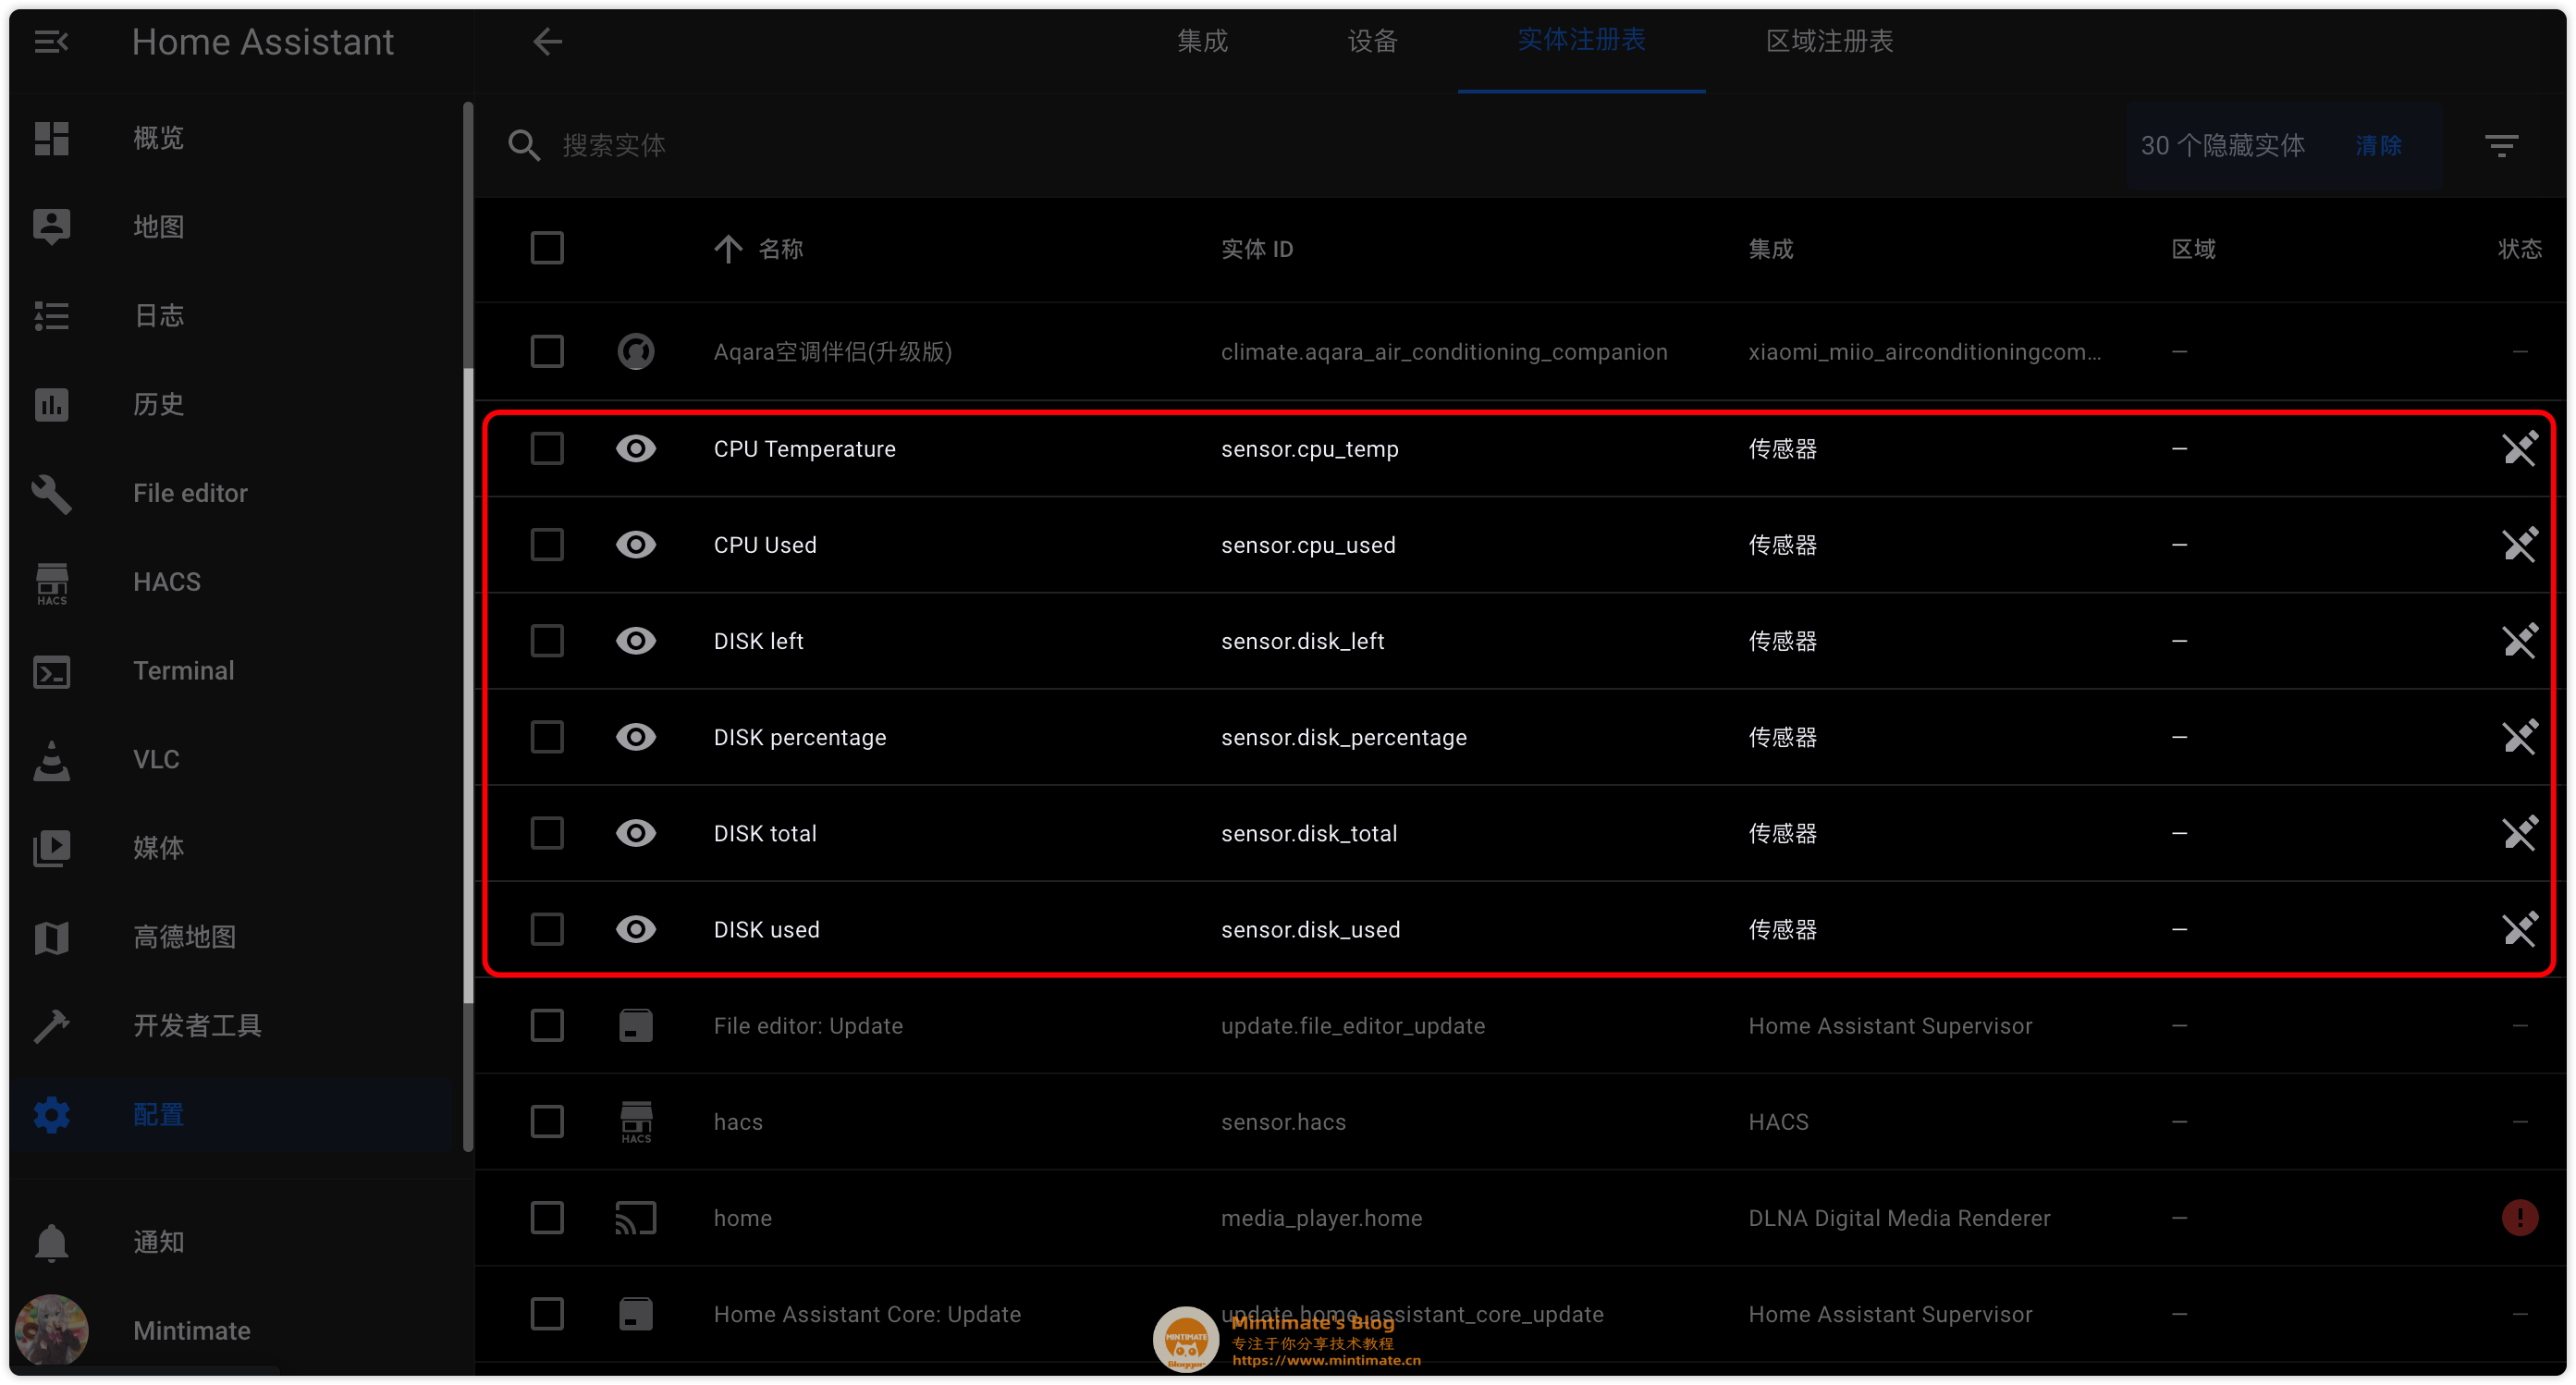
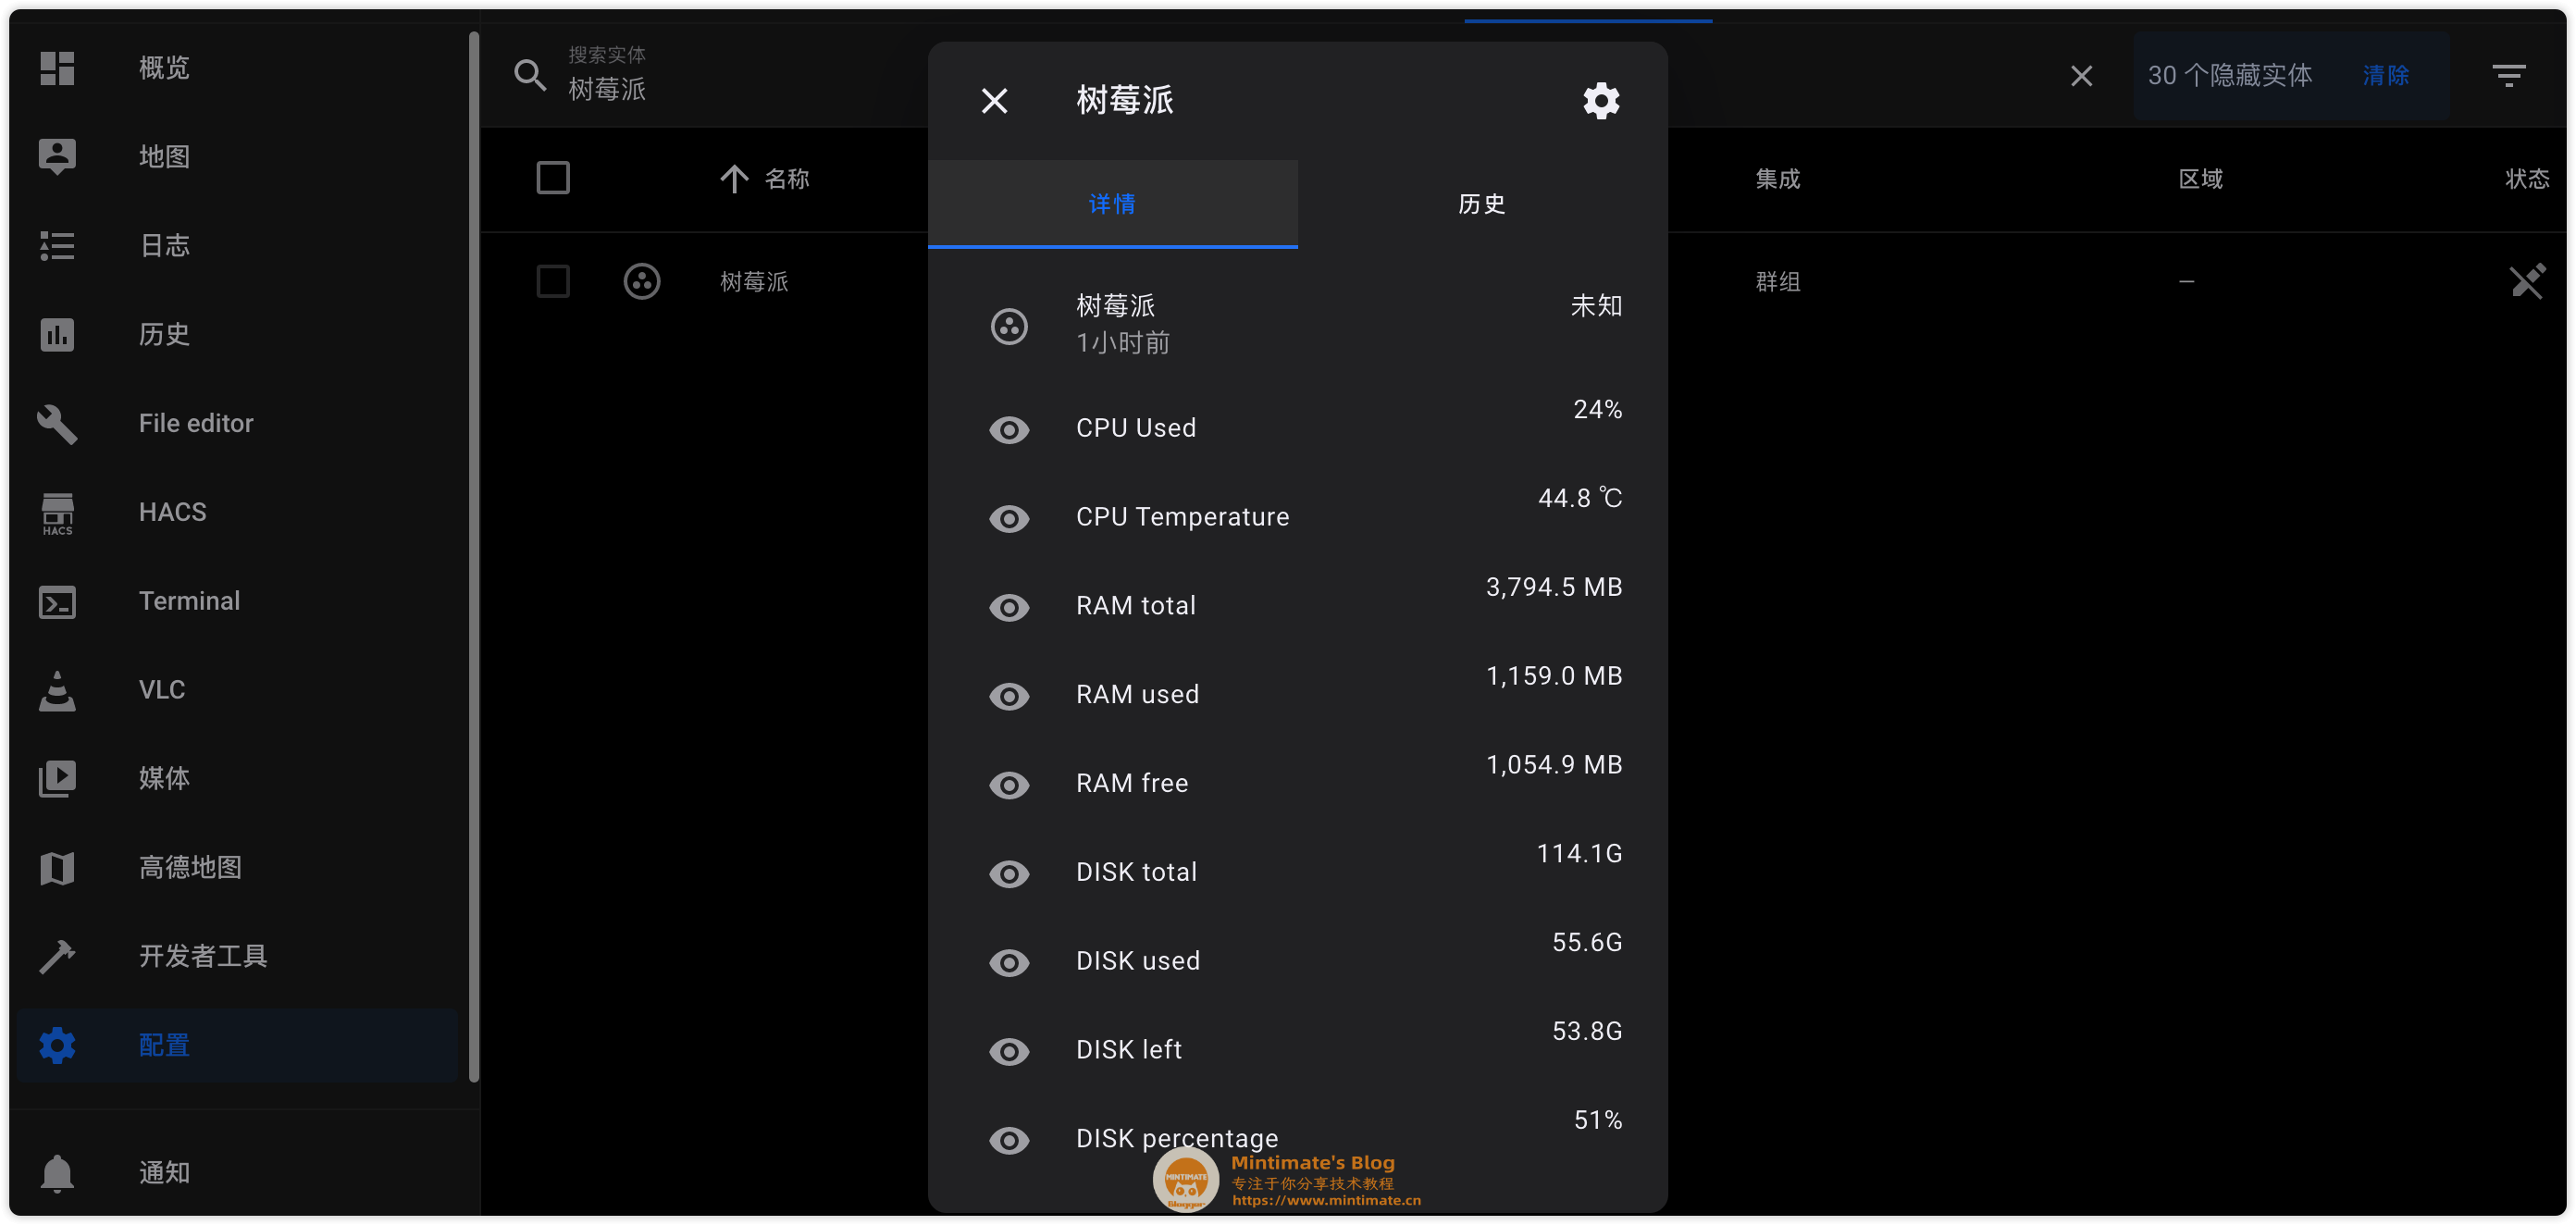
保存后,重启树莓派上的Home Assistant,就可以看到效果:
Group 的确,Group就和SQL的group by类似。使用Group分组后,可以把多个没有联系的对象,组合成一个关联性的 ,比如:https://www.home-assistant.io/integrations/group
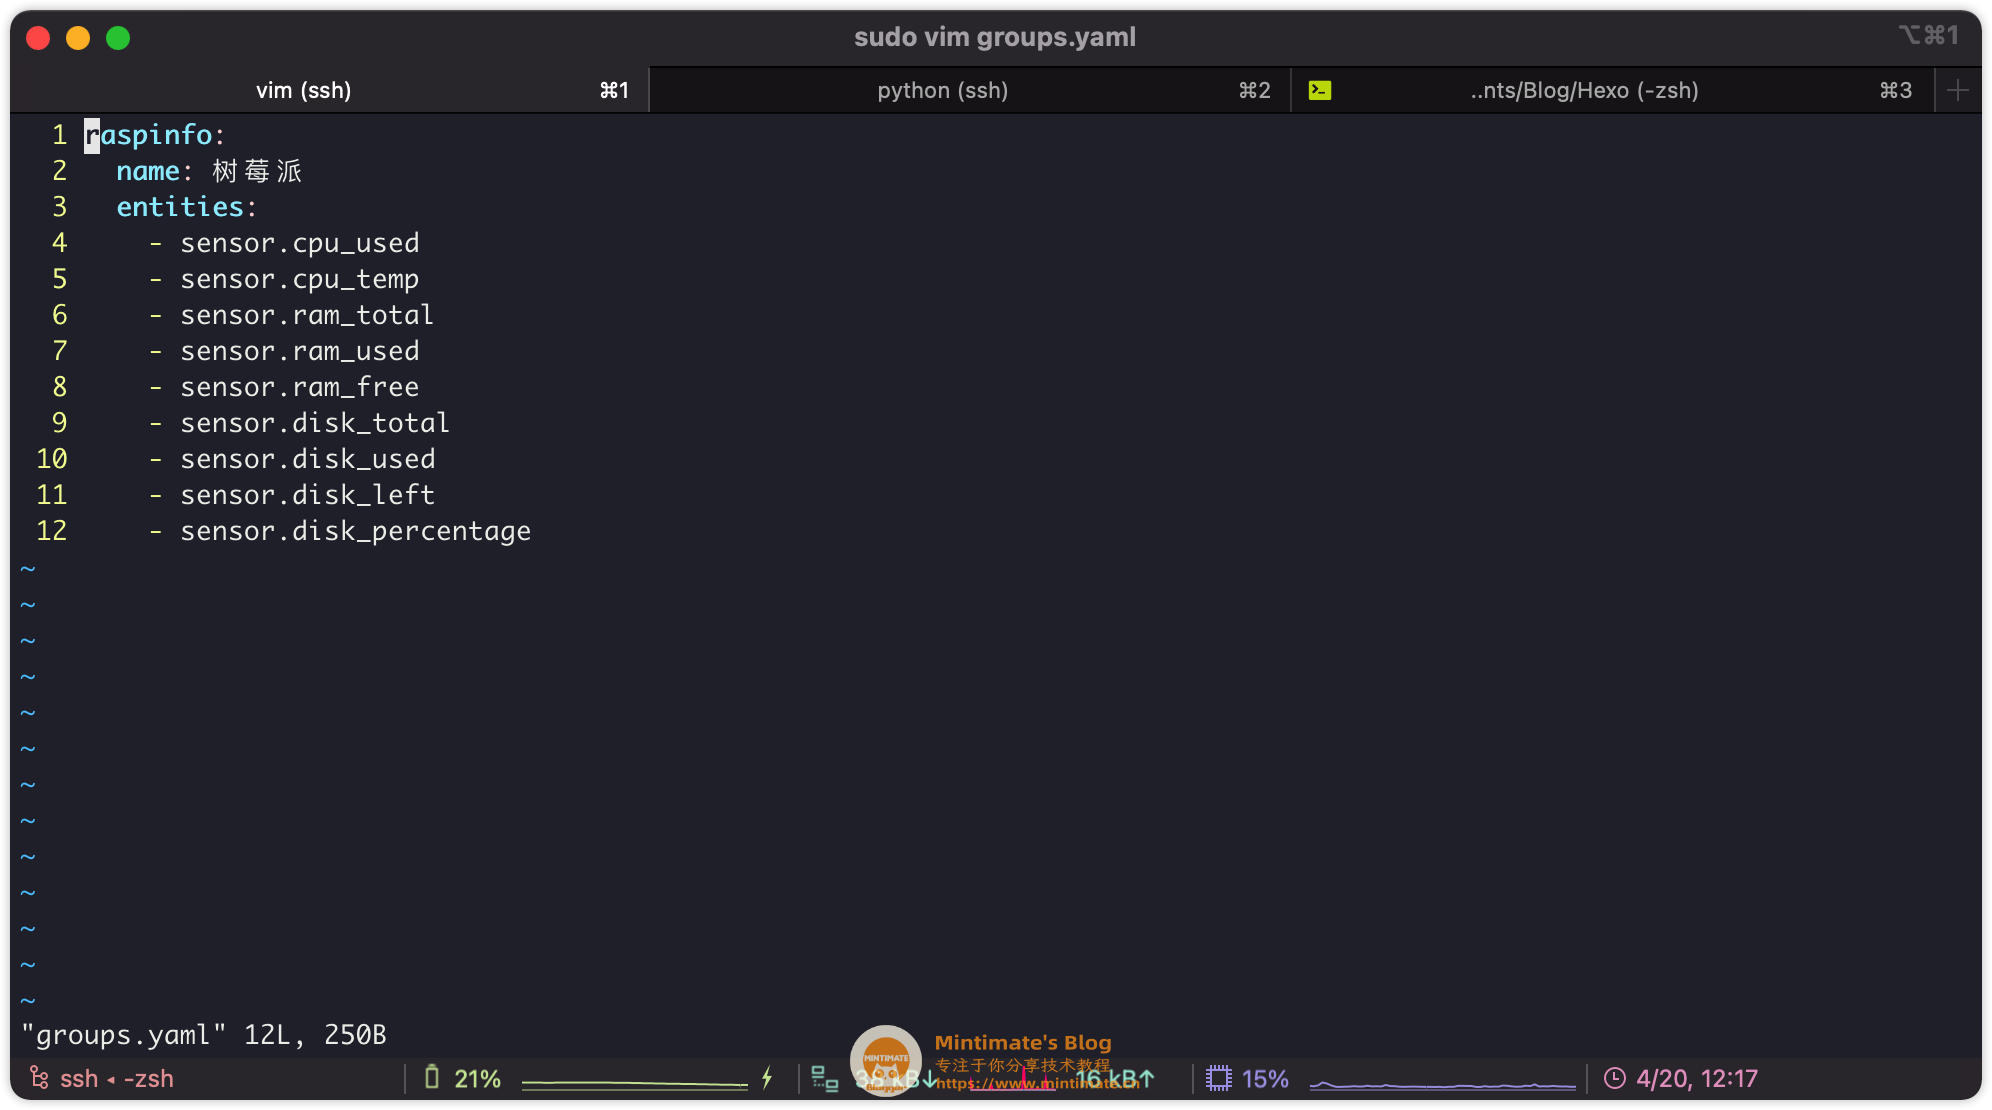
和刚刚一样,为了避免我的配置文件过长:groups.yaml文件,并添加以下内容:
1
2
3
4
5
6
7
8
9
10
11
12
raspinfo: name: 树莓派 entities: - sensor.cpu_used - sensor.cpu_temp - sensor.ram_total - sensor.ram_used - sensor.ram_free - sensor.disk_total - sensor.disk_used - sensor.disk_left - sensor.disk_percentage
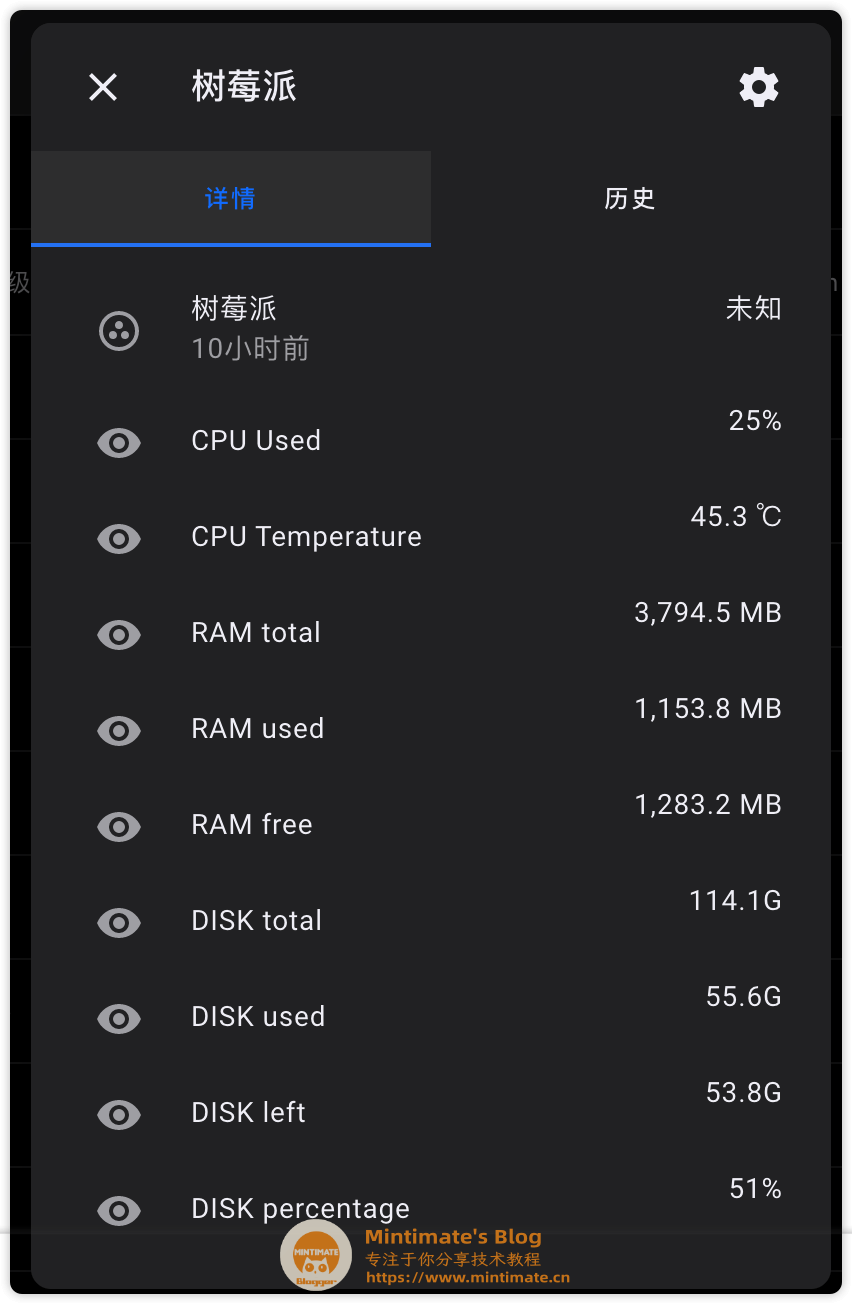
信息卡片 我们总是希望更直观地看到数据,所以我们会添加到主页的仪表盘,比如这样:
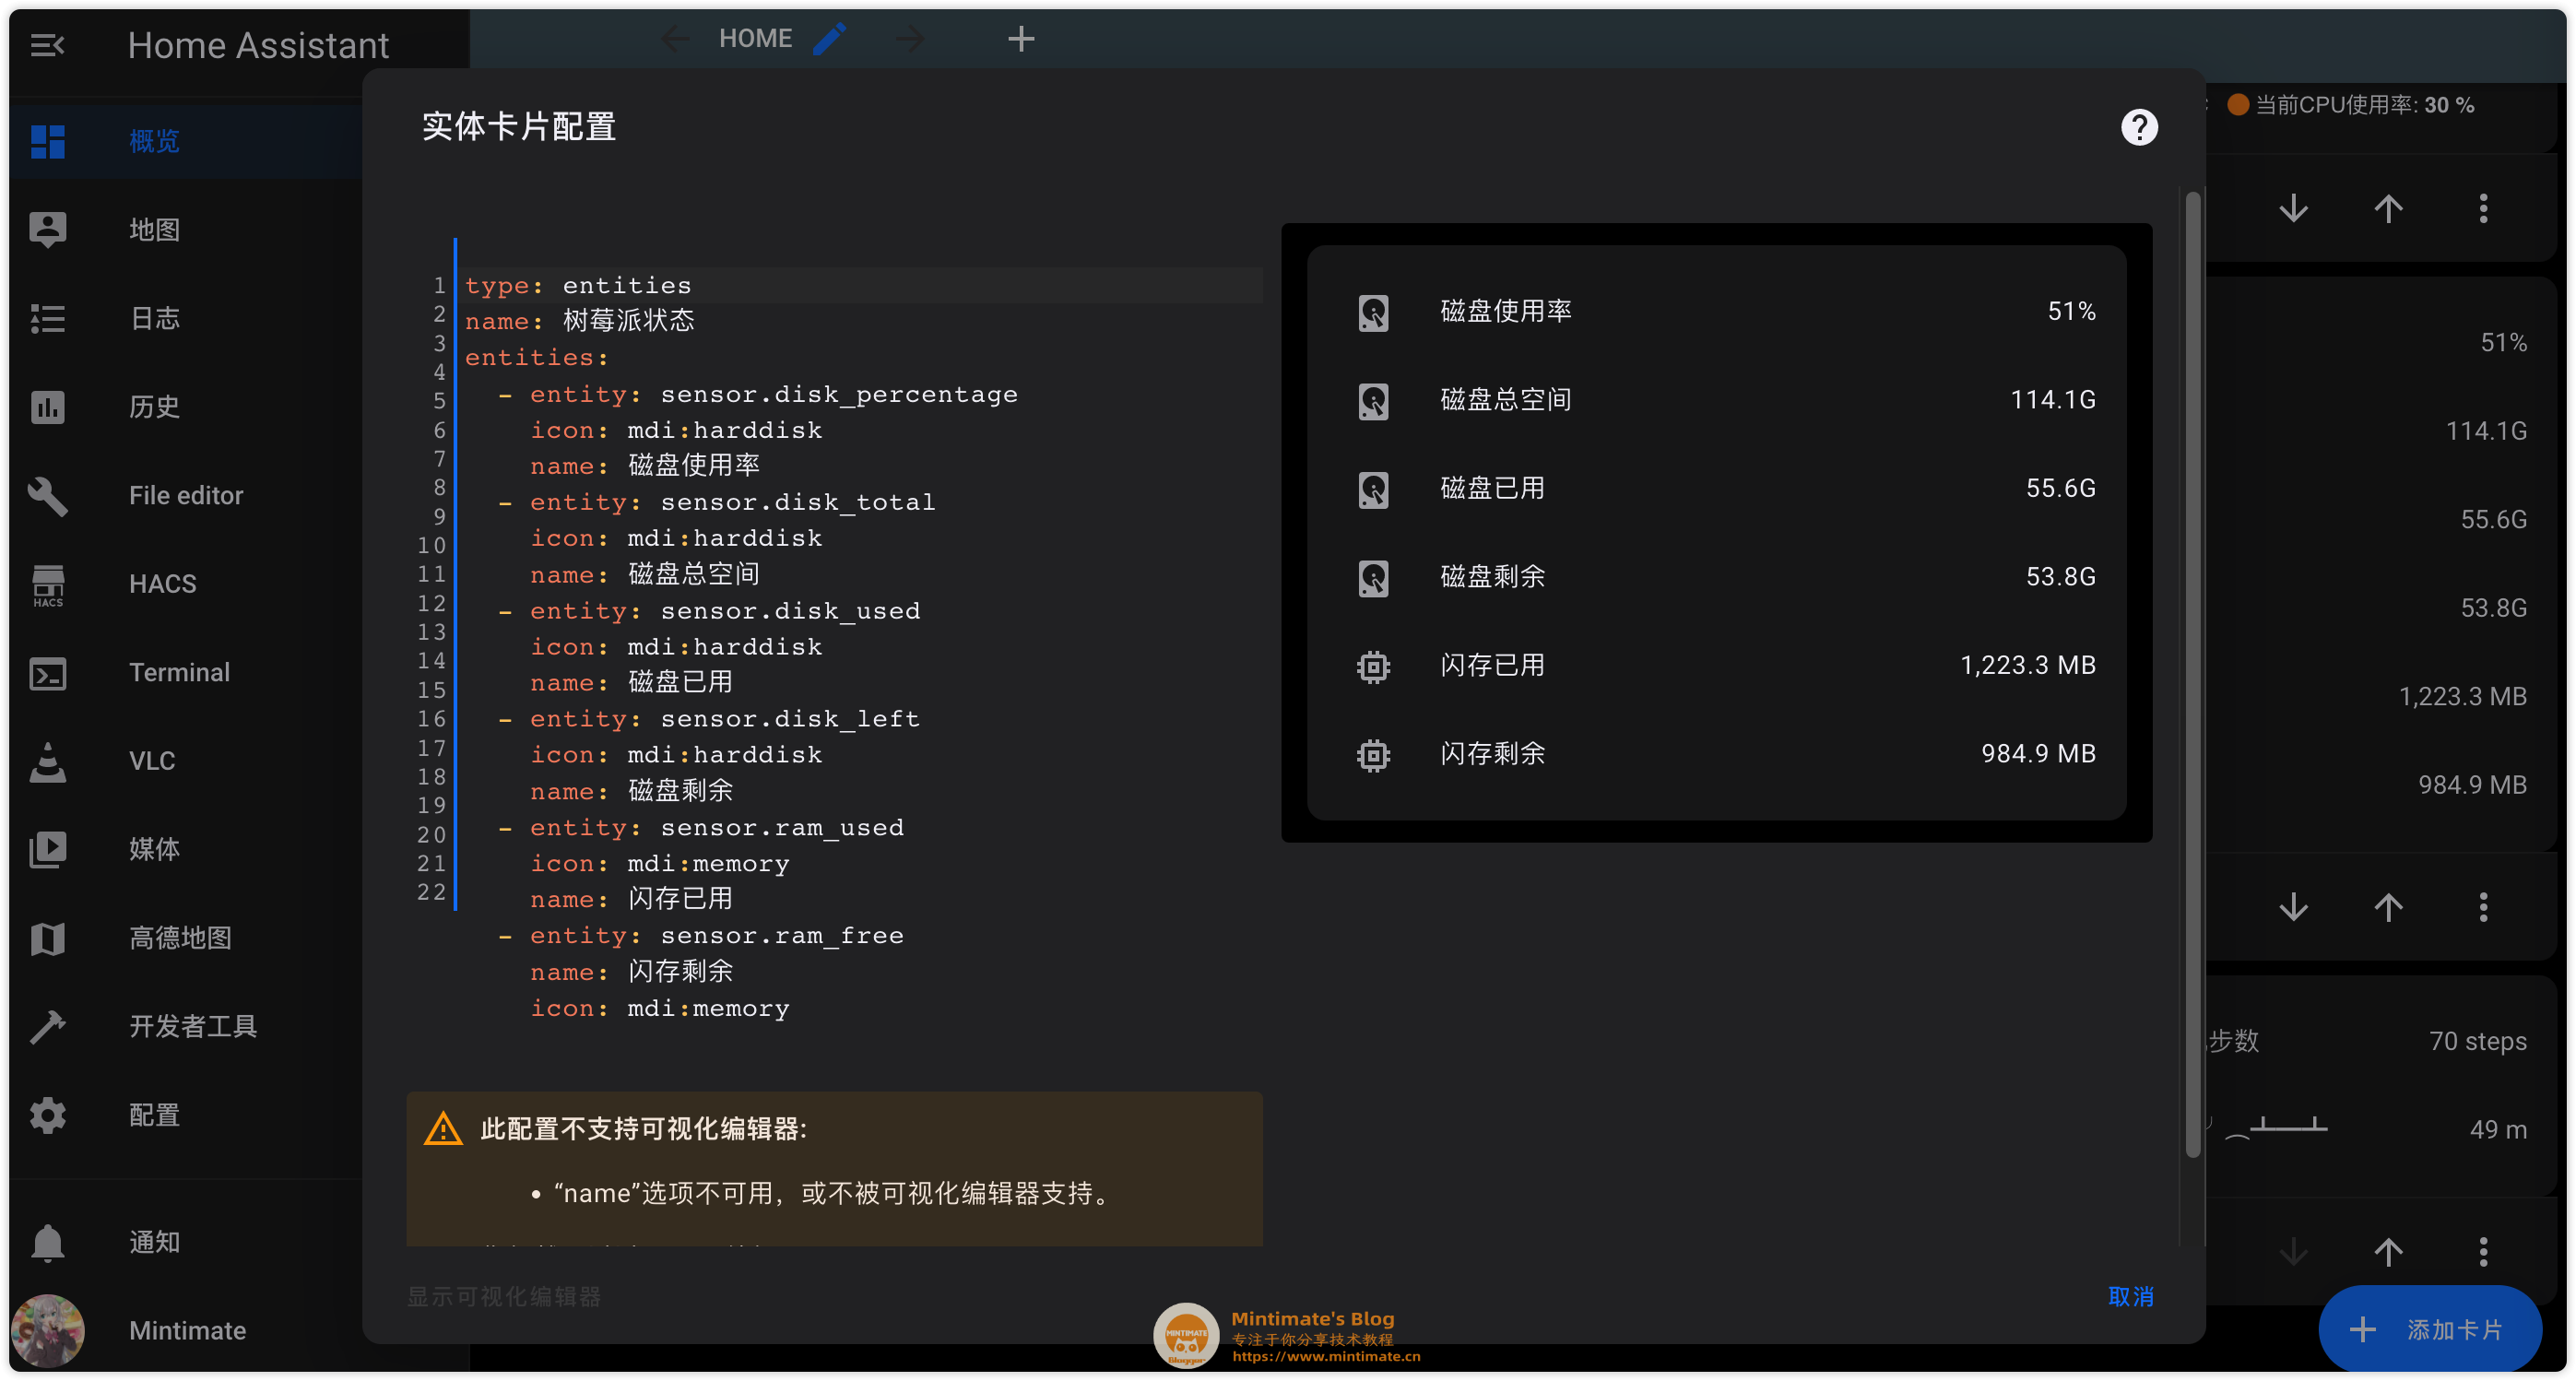
其实很简单,首先是最基础的卡片,也就是图中的内存数据,只需要添加自定义卡片,添加内容:
1
2
3
4
5
6
7
8
9
10
11
12
13
14
15
16
17
18
19
20
21
type: entities name: 树莓派状态 entities: - entity: sensor.disk_percentage icon: mdi:harddisk name: 磁盘使用率 - entity: sensor.disk_total icon: mdi:harddisk name: 磁盘总空间 - entity: sensor.disk_used icon: mdi:harddisk name: 磁盘已用 - entity: sensor.disk_left icon: mdi:harddisk name: 磁盘剩余 - entity: sensor.ram_used icon: mdi:memory name: 闪存已用 - entity: sensor.ram_free name: 闪存剩余 icon: mdi:memory
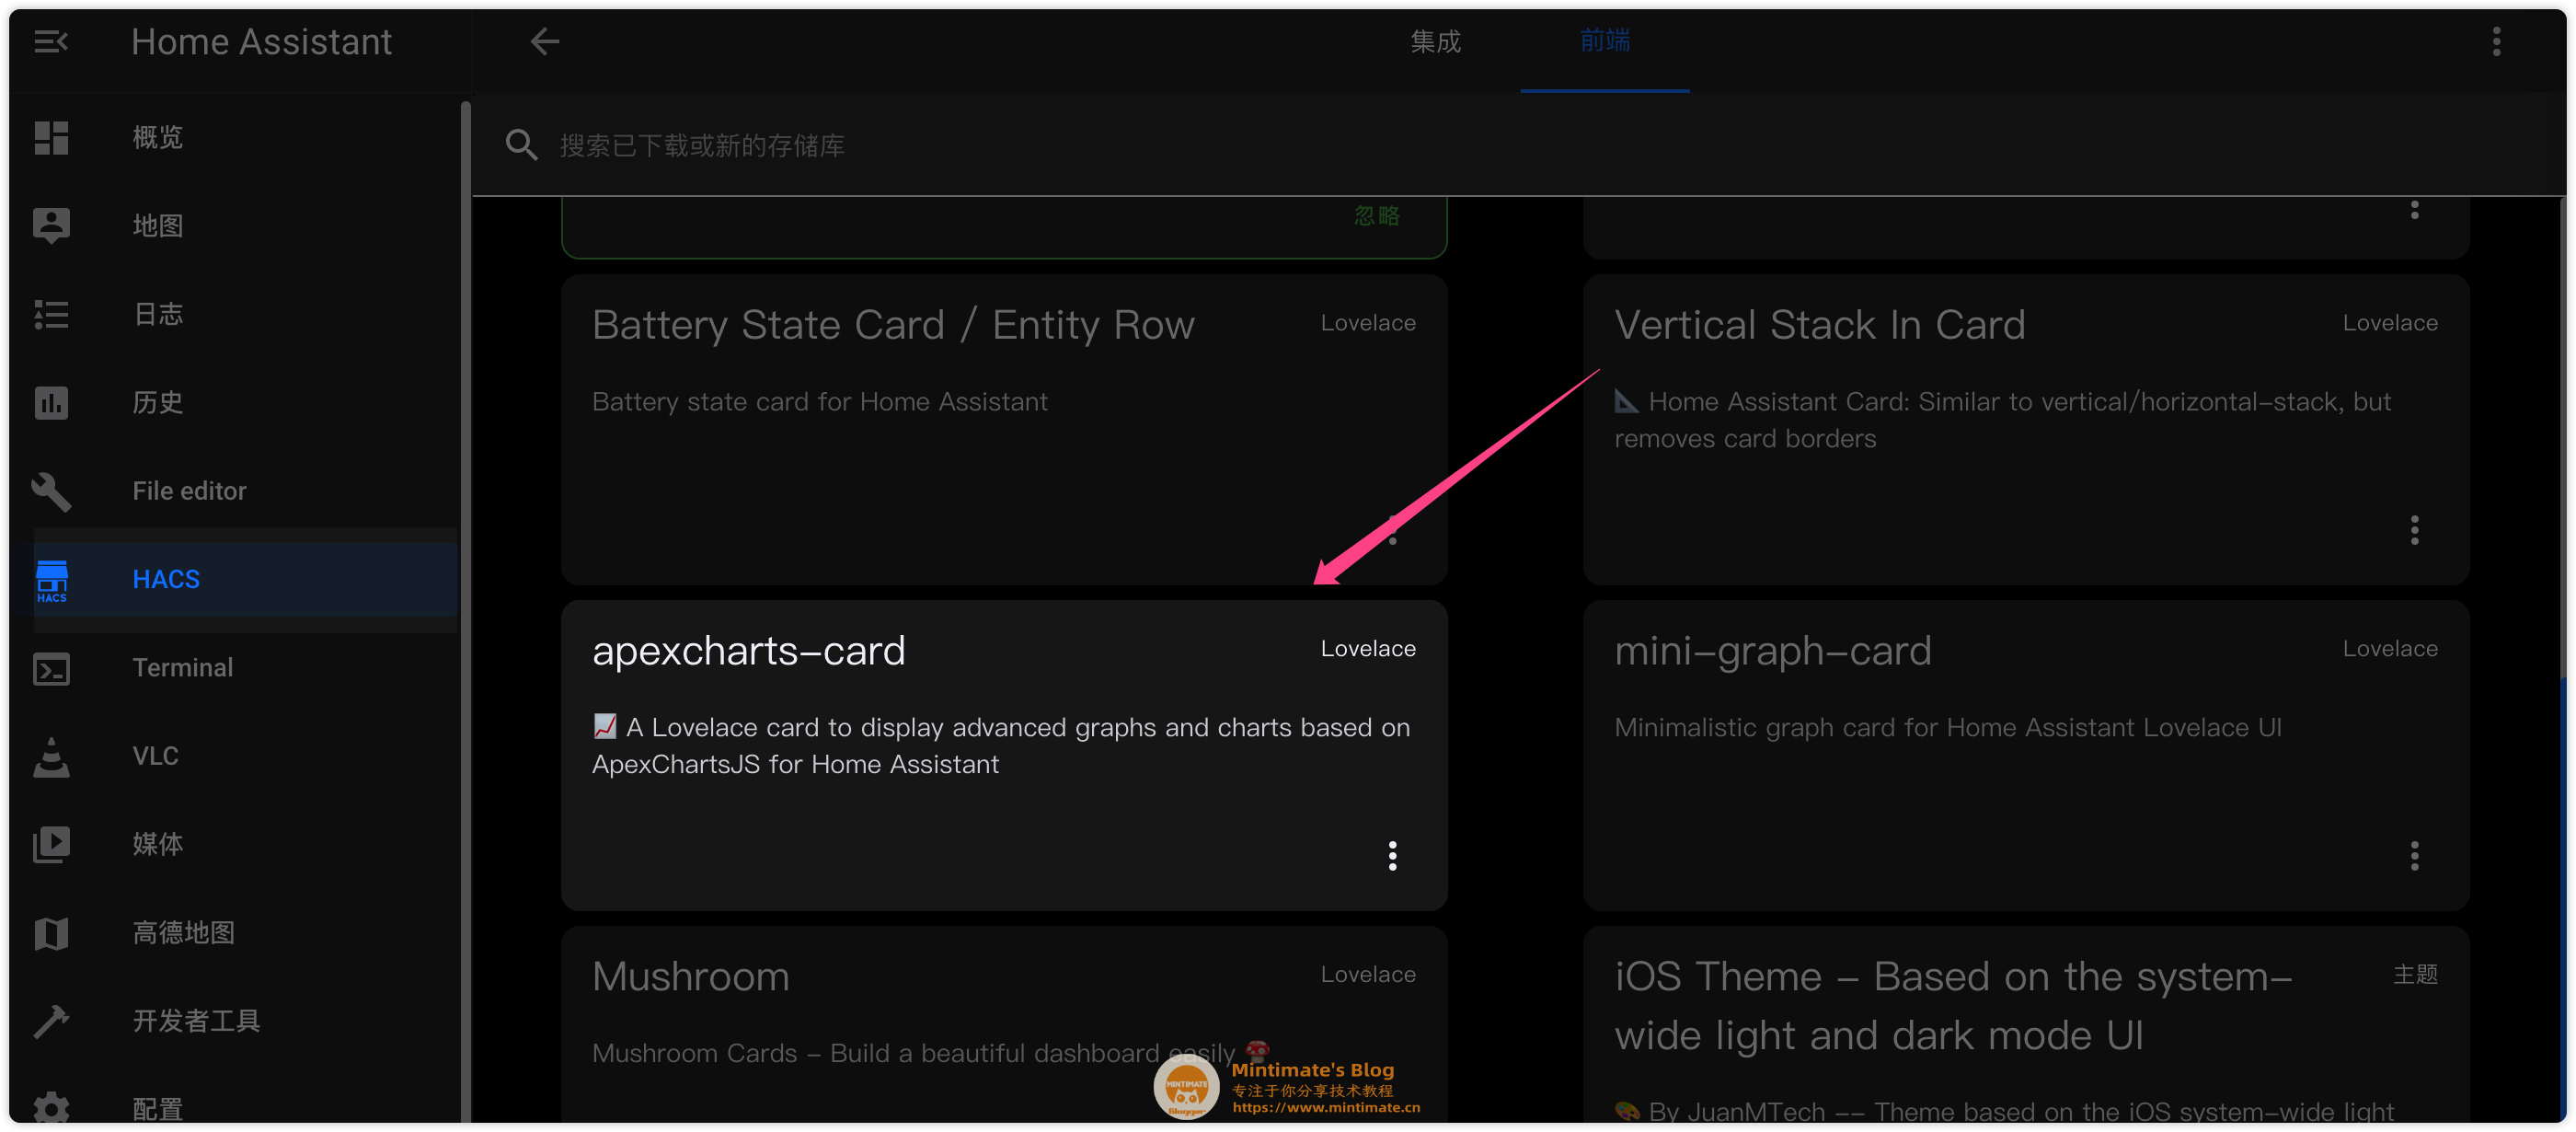
图标的属于高级第三方卡片了,如果你安装了HACS,可以直接安装这个插件:
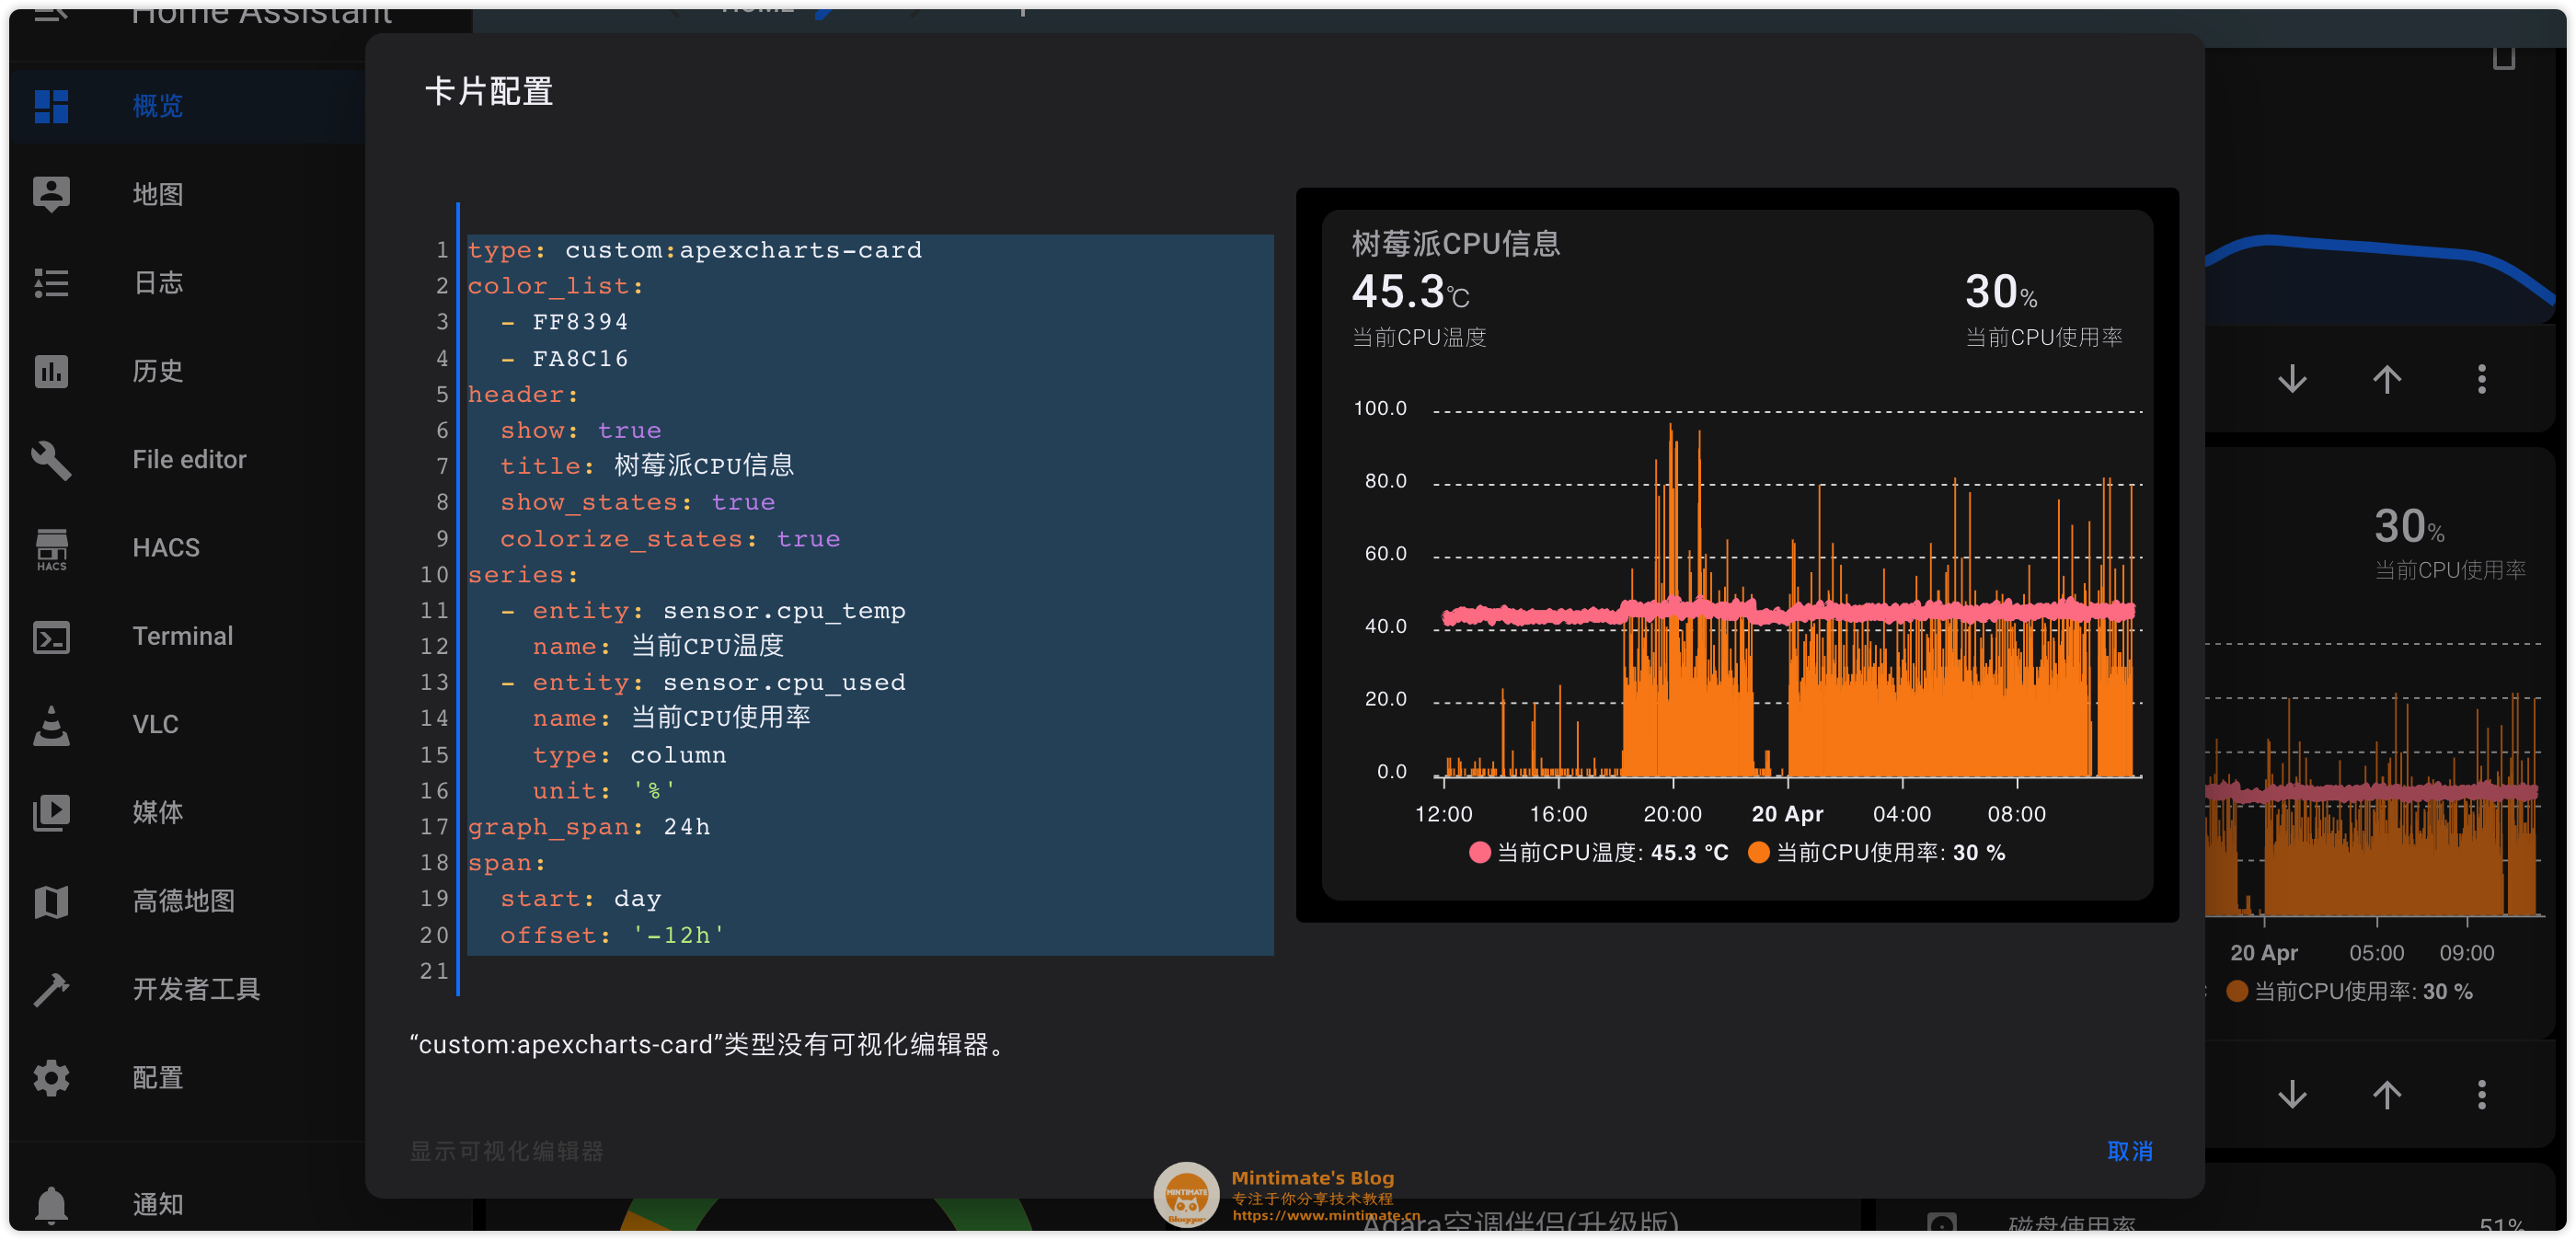
1
2
3
4
5
6
7
8
9
10
11
12
13
14
15
16
17
18
19
20
type: custom:apexcharts-card color_list: - FF8394 - FA8C16 header: show: true title: 树莓派CPU信息 show_states: true colorize_states: true series: - entity: sensor.cpu_temp name: 当前CPU温度 - entity: sensor.cpu_used name: 当前CPU使用率 type: column unit: '%' graph_span: 24h span: start: day offset: '-12h'
好好欣赏你的树莓派数据吧~~
END 其实,top命令自身就挺消耗树莓派资源的。如果不是经常需要检测树莓派,可以试试不监控CPU使用。
有时候问题,欢迎评论区留言嗷。也欢迎在B站关注我们: